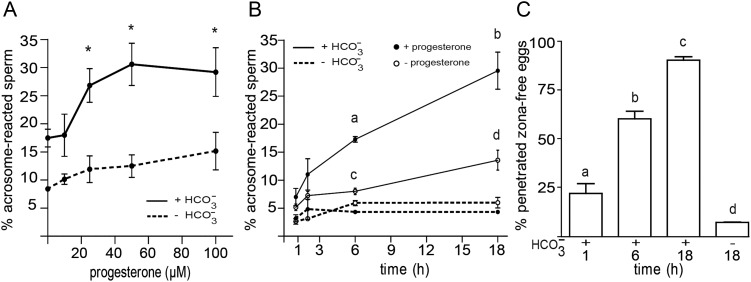
Figure 3.
Evaluation of the sperm functional state during capacitation. (A) Sperm were incubated for 18 h in media with (solid lines) or without (dotted lines)  , exposed to different concentrations of progesterone (1–100 µM) during the last 30 min of incubation, and evaluated for the occurrence of the AR by staining sperm with FITC-PSA. Results represent the mean value ± SEM of three independent experiments. *P < 0.01 versus all concentrations assessed. (B) Sperm were incubated for different times (1–18 h) in media with (solid lines) or without (dotted lines)
  , exposed to progesterone (25 µM) (full circle) or vehicle (0.05% v/v DMSO) (open circle) during the last 30 min of incubation, and evaluated for the occurrence of AR by staining sperm with FITC-PSA. Results represent the mean ± SEM of three independent experiments. a, b, d versus all time assessed, P < 0.05; c versus all times assessed except 2 h, P < 0.05. (C) Sperm were incubated in media with or without
  for different time periods (1, 6 or 18 h), co-incubated with zona-free hamster oocytes in capacitating media for 2.5 h, and the percentage of penetrated oocytes determined. Results represent the mean ± SEM of three independent experiments. Bars with different letters are significantly different, P < 0.05.

