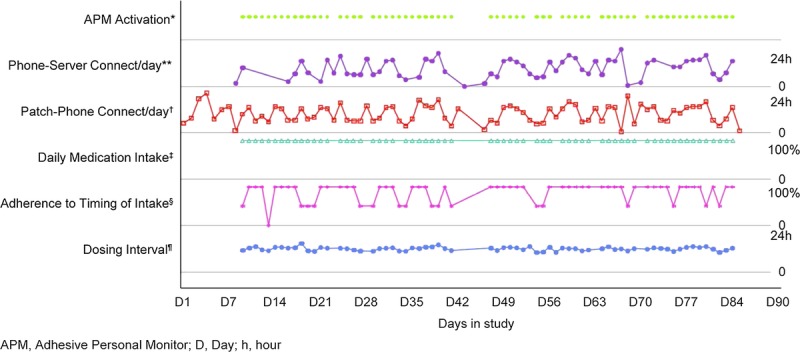
FIGURE 3.

Representative example of an individual patient adherence profile and system functionality records. D, day; h, hour. *For APM activation, each dot represents an APM continuously active for 24 hr. The absence of a dot between days 42 and 49 indicates that the patient was not wearing the patch during this period. **Phone–server connection reports the longest time interval between two connections of the smartphone with the server on each day. For this patient, this time varied between 30 min and 24 hr, indicating difficulties with mobile network access. †Patch–phone connection reports the longest time interval between two connections of the APM with the smartphone on each day. This time interval varied also between 30 min and 24 hr, indicating that the smartphone was not carried permanently by the patient in proximity of the APM. However, because the data were stored on the APM, the APM data were still communicated to the smartphone and then to the server at least once a day. ‡Detection of daily medication ingestion was 100% during the entire study period. §Adherence to the prescribed time of intake fluctuated between 100%, 50% (one of the two daily intakes was not on time), and 0% (time missed for both daily intakes). ¶Dosing interval was the time between morning and evening intakes and oscillated around 12 hr, indicating the absence of major time deviation from the prescribed schedule for medication taking.
