Figure 6.
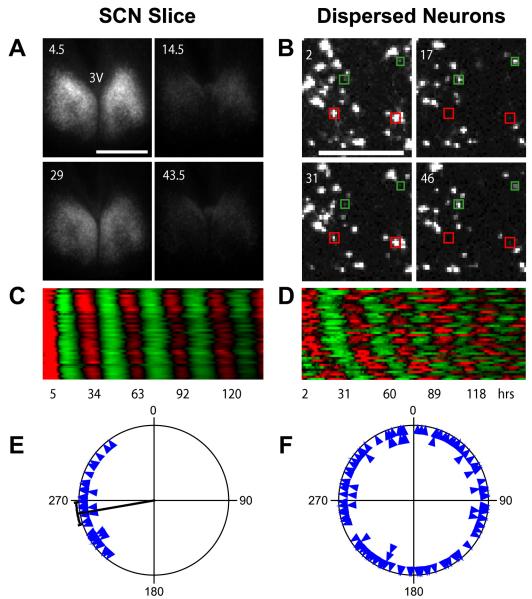
Network Interaction Synchronizes Cellular Oscillators in Cry2−/− SCN (A) Bioluminescence images of a Cry2−/− SCN slice culture at peak and trough phases, showing stable and synchronized oscillations. Numbers indicate hours after start of imaging. 3V indicates third ventricle. Scale bar is 500 μm.(B) Bioluminescence images of dissociated individual Cry2−/− SCN neurons showing cell-autonomous, desynchronized oscillations. Note that the cells highlighted with red and green are antiphasic. Numbers and scale bar are as in (A). See also Figure 5 and Movie S1.(C and D) Raster plots of bioluminescence intensity of individual Cry2−/− neurons in SCN slice in (A) and from dispersed culture in (B). Forty cells are presented in each plot, and each horizontal line represents a single cell. Values above and below the mean are shown in red and green, respectively.(E and F) Circadian phase plots of rhythmic Cry2−/− neurons within the SCN slice in (A) and from the dispersal culture in (B). Each blue triangle represents the phase of one cell at the end of a 6-7 day experiment, where 0° = phase of the fitted peak of the rhythm. The radial line indicates the average phase, and the arc indicates the 95% confidence interval for mean phase. Rayleigh test: p < 0.0001 (n = 40) for neurons in the SCN slice; p = 0.97 (n = 121) for dissociated neurons. Most dissociated Cry2−/− SCN neurons expressed rhythmic patterns of bioluminescence that were initially partly synchronized by medium change but then gradually desynchronized due to varying intrinsic periods in the absence of functional intercellular coupling (B, D, and F), whereas cells in the slice culture were synchronized across the SCN and throughout the course of the experiment (A, C, and E).

