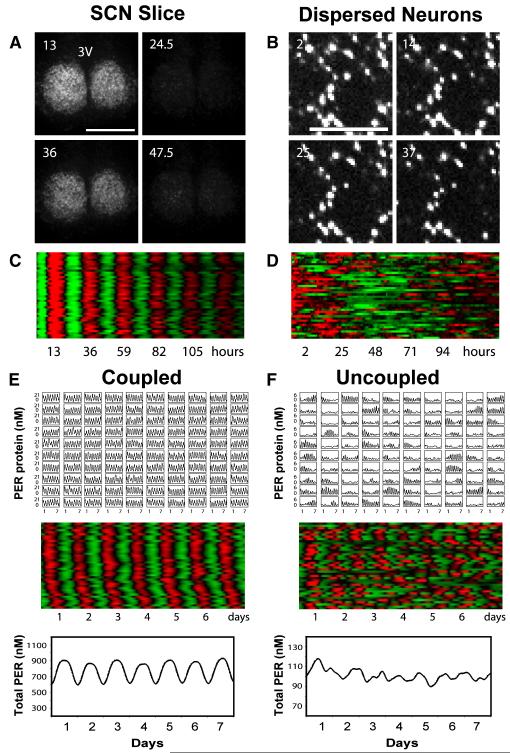
Figure 7.
Bioluminescence Imaging and Mathematical Simulations Demonstrate that Intercellular Coupling Can Stabilize and Sustain Circadian mPer2Luc Rhythms in Cry1−/− SCN (A) Bioluminescence images of a representative Cry1−/− SCN slice culture at peak and trough phases, showing stable and synchronized bioluminescence oscillations. Numbers and scale bar are as in Figure 6.(B) Bioluminescence images of dissociated individual Cry1−/− SCN neurons showing cell-autonomous, largely arrhythmic patterns of high bioluminescence intensity. Numbers and scale bar are as in (A). See also Figure 5 and Movie S2.(C and D) Raster plots of bioluminescence intensity of individual Cry1−/− neurons in SCN slice in (A) and from dispersed culture in (B). Plots were constructed as in Figure 6. Dissociated Cry1−/− SCN neurons were largely arrhythmic, whereas cells in the slice culture were highly rhythmic and very tightly synchronized across the SCN.(E and F) Mathematical simulation for coupled oscillators (E) and uncoupled oscillators (F). Time courses of 100 oscillators (single-cell PER protein concentration in 10×10 grid, top), raster plots of 40 oscillators (middle), and the sum (total PER concentration for 100 oscillators, bottom) are presented for each condition.

