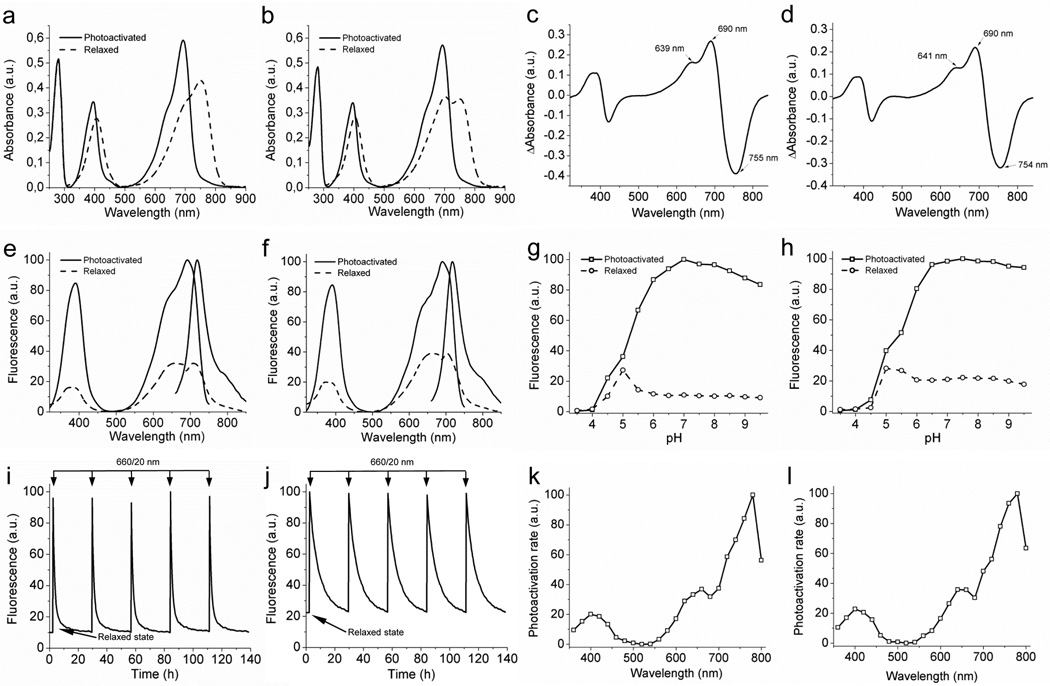
Figure 1. Spectral and biochemical properties of PAiRFP1 and PAiRFP2 in vitro.
Absorbance spectra of the relaxed (dashed line) and photoactivated (solid line) PAiRFP1 (a) and PAiRFP2 (b). Difference spectra “relaxed” minus “photoactivated” for PAiRFP1 (c) and PAiRFP2 (d). Fluorescence spectra of the relaxed (dashed line) and photoactivated (solid line) PAiRFP1 (e) and PAiRFP2 (f). Equilibrium pH dependence for fluorescence of the relaxed (circles) and photoactivated (squares) PAiRFP1 (g) and PAiRFP2 (h). Fluorescence of the relaxed form was normalized to the maximal fluorescence of the photoactivated form. Time courses of the PAiRFP1 (i) and PAiRFP2 (j) fluorescence during multiple cycles of photoactivation and subsequent relaxation in the dark. After purification, the protein was briefly photoactivated with 660 nm light (26 mW/cm2). After the protein reached the relaxed state in the dark, it was briefly photoactivated again with 660 nm light (26 mW/cm2). Fluorescence in the photoactivated state was normalized to 100%. Spectral dependence of the maximal photoactivation rate for PAiRFP1 (k) and PAiRFP2 (l). The maximal values of the photoactivation rates were normalized to the light power in each wavelength band.

