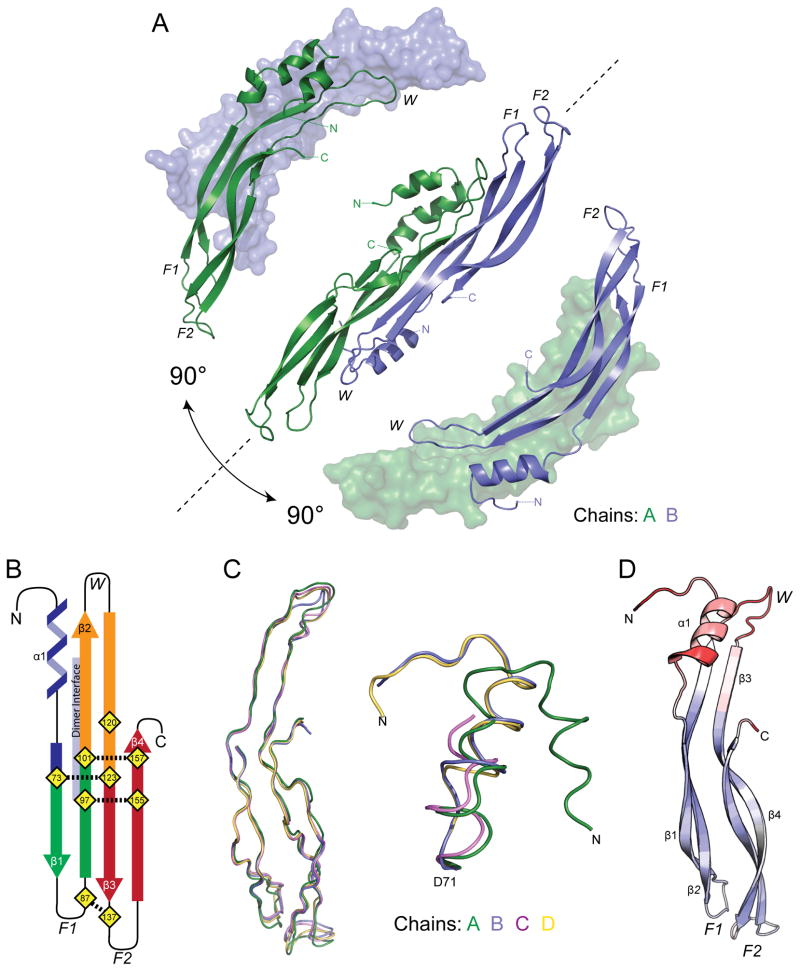
Figure 1. Crystal structure of PRDC.
(A) Ribbon representation of the X-ray crystal structure of PRDC with each monomer colored separately (green, blue). ‘Bottom’ view is shown in the center with corresponding ‘Side’ views rotated through the labeled axis. (B) Topology diagram of PRDC with the fingers colored (F1, green and F2, red). The β-strands in the wrist of PRDC are colored orange. The location of the dimer interface is annotated and colored light purple. (C) PRDC chains A–D were aligned using residues 72–160. The alignment results are depicted for the core DAN domain (left) and the N-terminal helix region (right). (D) PRDC monomer (chain B) colored by increasing crystallographic temperature factors from blue to red. See also Figure S1.

