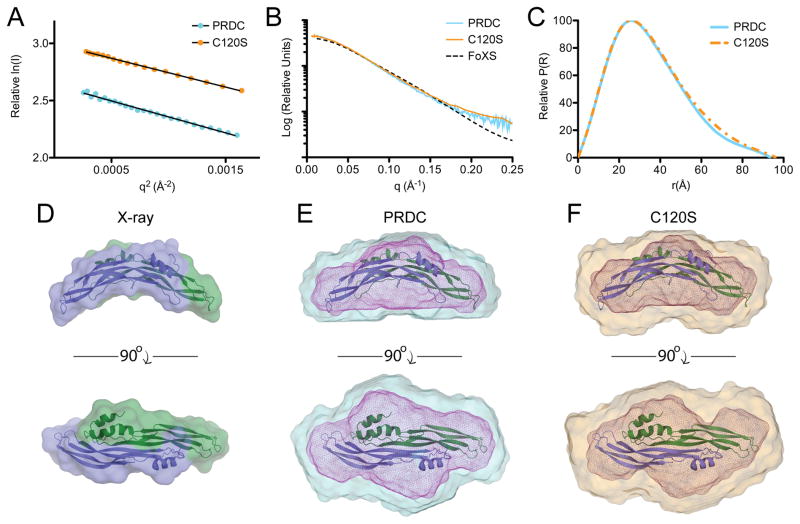
Figure 3. SAXS analysis of WT and C120S PRDC.
(A) Guinier plot of PRDC WT and PRDCC120S. The low-resolution scattering angles depict well-ordered scattering with negligible aggregation or repulsion. (B) Intensity distribution of the SAXS scattering function with the simulated data plotted using FoXS and the PRDC crystal structure. (C) Pair-wise distance distribution function of PRDC and PRDCC120S. (D) Crystal structure combined surface and ribbon representations. (E–F) Superposition of the crystal structure (ribbon) with SAXS ab initio reconstructions of WT PRDC (D) and PRDCC120S (E). Two views are rotated through the long axis. Larger surface represents DAMAVER solution while smaller internal mesh represents the filtered Damfilt models. See also Figures S3 and S4 and Table S1.

