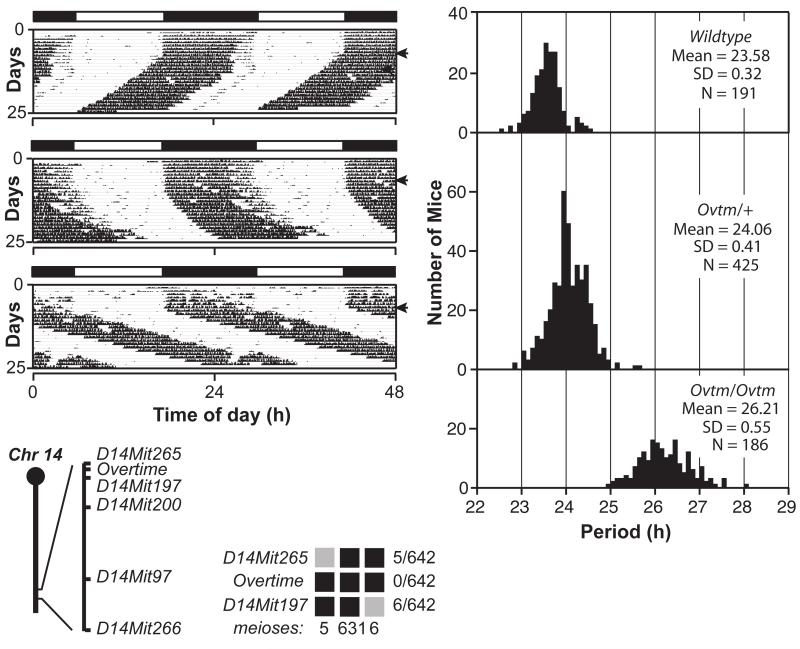
Figure 3. Semidominant phenotype of Overtime and genetic mapping.
(A) Representative actograms of wildtype, (B) Ovtm/+ and (C) Ovtm/Ovtm [BTBR/J × C57BL/6J] F2 mice. The actograms are plotted as described in Figure 1.
(D) Period distribution of F2 intercross progeny. The three panels from top to bottom represent wildtype, Ovtm/+ and Ovtm/Ovtm mice, respectively.
(E) Ovtm maps between D14Mit265 and D14Mit197 on chromosome 14. Haplotypes of the 321 Ovtm/Ovtm F2 intercross progeny (642 meioses) are on the right. Black boxes represent BTBR/J alleles, while grey boxes represent heterozygous alleles (BTBR/J and C57BL/6J). The number of recombinants per total meioses is indicated to the right of the haplotype map. From Siepka et al. (Siepka et al. 2007).

