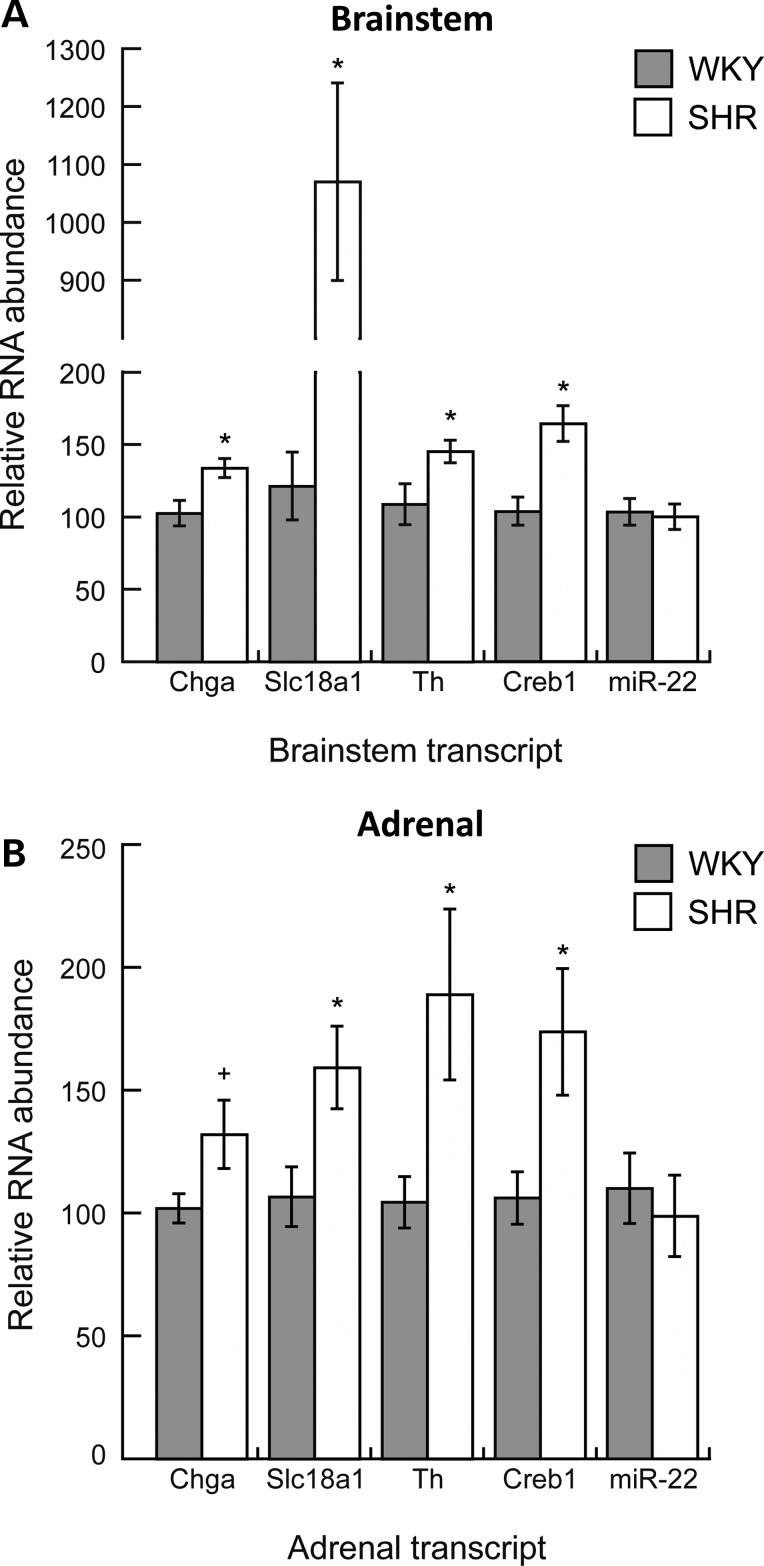
Figure 5.
Endogenous gene expression by quantitative RT–PCR: The measurement of transcript abundance in central and peripheral tissues of the SHR nervous system. We performed quantitative RT–PCR to determine in vivo mRNA and microRNA expression profiles in central (brainstem) and peripheral (adrenal gland) components of the SHR nervous system for the following transcripts: Chga, Slc18a1/Vmat1, Th, Creb1 and miR-22. Data were normalized to beta-actin in the same sample, and analyzed with an unpaired Student's t-test, and presented as mean ± standard error. *P < 0.05 versus WKY (significant); +P = 0.055 versus WKY (marginally significant). Normalization of miR-22 abundance in the brainstem by a snoRNA (SNORD61) instead of beta-actin resulted in 0.76-fold (P < 0.05) decreased miR-22 in SHR compared with WKY; beta-actin normalization resulted in no difference. Normalization of miR-22 abundance in the adrenal gland by SNORD61 was consistent with beta-actin normalization, resulting in no difference between SHR and WKY.

