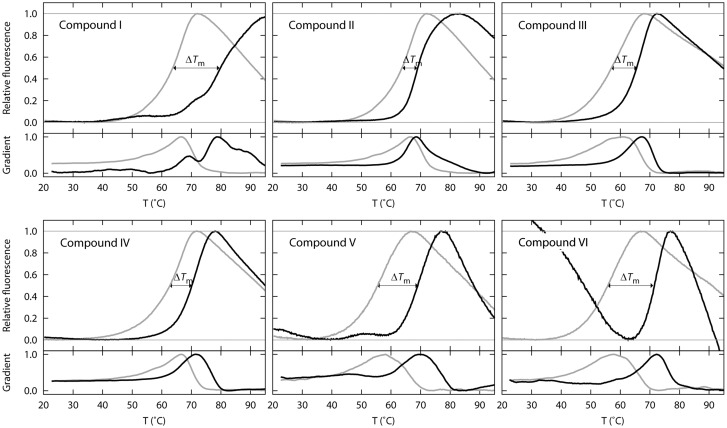
Figure 1.
Differential scanning fluorimetry profiles for six candidate pharmacological chaperones. Thermal denaturation profiles of purified wild-type ATR (0.086 mg/ml) (fluorescence at 610 nm vs. temperature [°C]). In grey, curve for ATR incubated with DMSO (final concentration 2%); in black, purified ATR incubated with 0.04 mg/ml of compounds I–VI. The melting temperature (Tm) was taken as the temperature at which the maximum fluorescence was achieved; ΔTm was calculated as the difference between the Tm in the presence of a ligand and Tm in the presence of DMSO. The lower figure for each graph represents the data without scaling.

