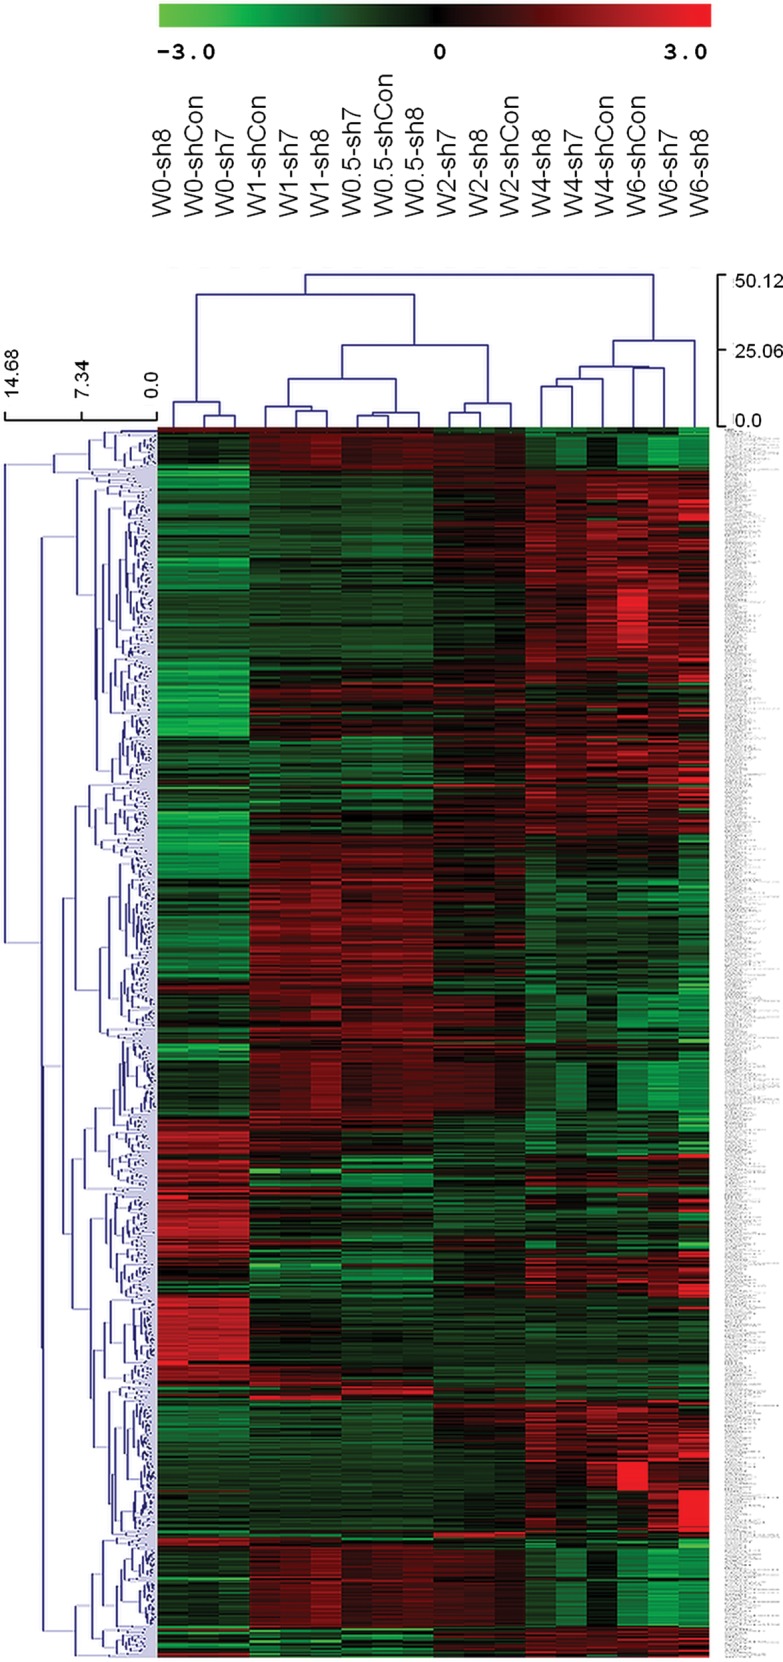
Figure 4.

Hierarchical clustering of gene expression levels across multiple time points for two cell populations with NLGN4X knockdown (sh7 and sh8) and one cell population without knockdown (shCon). For each time point, the average expression values from two to three replicate samples were used.
