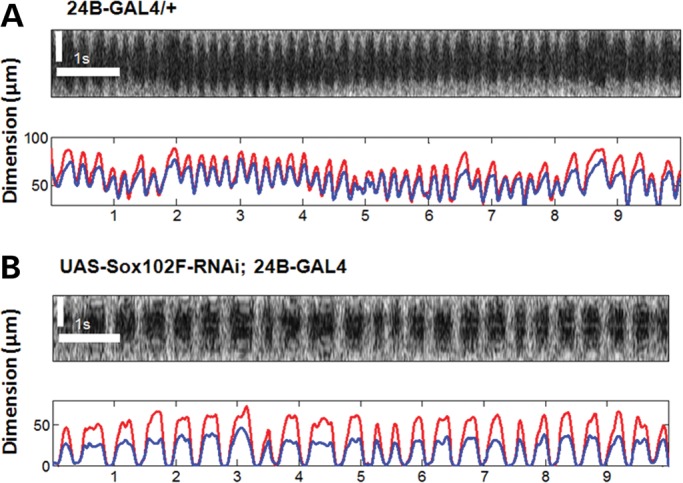
Figure 2.

Obtaining functional information about cardiac function from structural OCT images. (A) A pseudo M-mode OCT image from the center of the main heart chamber (top) and the automatically generated plots for the heart dimensions (below) of a fly from the control group. Rapidly repeated cross-sectional OCT images over the clearest and largest heart chamber were performed for each fly where the single A-scan over the center of the heart chamber in each cross-sectional image is extracted to create a pseudo M-mode OCT image. The regularity of the heart beats can be visualized from the M-mode image as well as the resulting dimension plot. This particular fly has been characterized with a HR of 258 BPM, EDDt and EDDv of 80 and 108 µm, respectively, ESDt and ESDv of 49 and 71 µm, respectively, ESA and EDA of 2605 and 5644 µm2, respectively. (B) A pseudo M-mode OCT image (top) and the automatically generated plots for the heart dimensions (bottom) of a fly from the UAS-Sox102F-RNAi; 24B-GAL4 group. The M-mode image shows irregular beating patterns. This particular fly has been characterized with a HR of 138 BPM, EDDt and EDDv of 54 and 32 µm, respectively, ESDt and ESDv of 1 and 1.4 µm, respectively, ESA and EDA of 6 and 1036 µm2, respectively. Red lines in the dimension plots correspond to axial dimensions, whereas the blue lines correspond to transverse dimensions. Scale bars: 50 µm in the vertical dimension; 1 s in the horizontal dimension.
