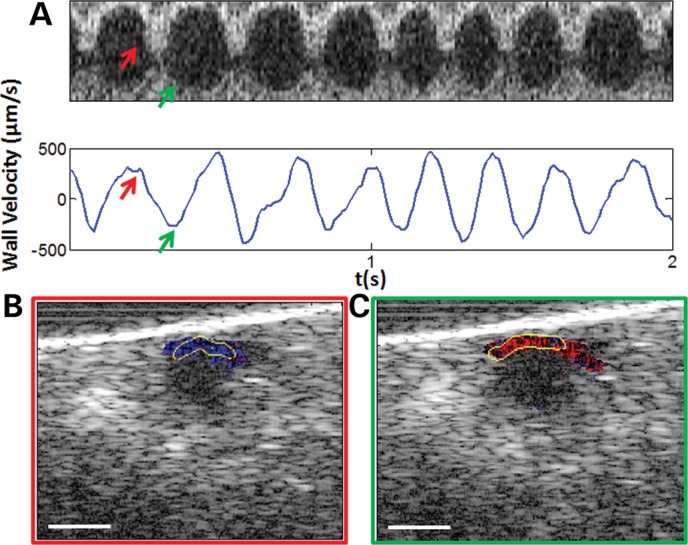
Figure 3.

Extracting systolic and diastolic wall velocities using Doppler OCT. (A) A pseudo M-mode OCT image from the center of the main heart chamber (top) and the corresponding wall velocity plot extracted by Doppler analysis (bottom). A positive peak velocity is observed during the systole (an example is indicated by the red arrows), and a negative peak velocity is observed during the diastole (an example is indicated by the green arrows). A smoothing filter has been applied to the Doppler plot in order to highlight the velocity profile more clearly. (B and C) Cross-sectional color Doppler OCT image showing the localization of the Doppler signal at the upper portion of the heart wall during the systolic and diastolic phases. The outer boundary of the automatically segmented heart wall is shown by the yellow curve. Scale bars: 50 µm.
