
Figure II.
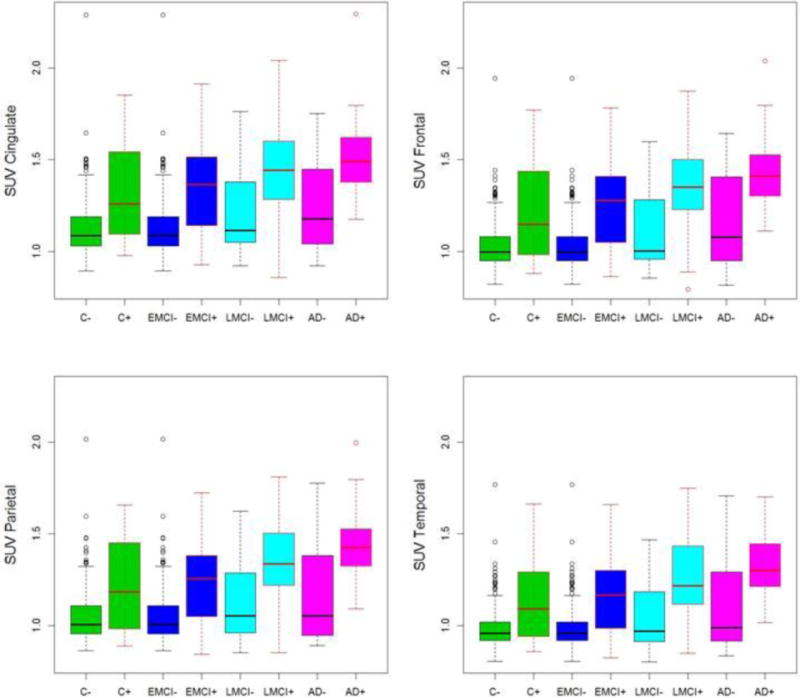
Box plot figures of beta-amyloid PET SUVR by diagnosis and E4 status in 4 cortical regions. As can be seen the effect of E4 status is far more striking than the effect of clinical diagnosis. For example, E4+ controls had higher mean SUVRs than E4− EMCI, E4− LMCI and E4− AD. E4+ MCI subjects had higher mean SUVRs than E4− AD. See methods and results for details of fitted models. The cingulate has the highest signal of the four regions across all groups.