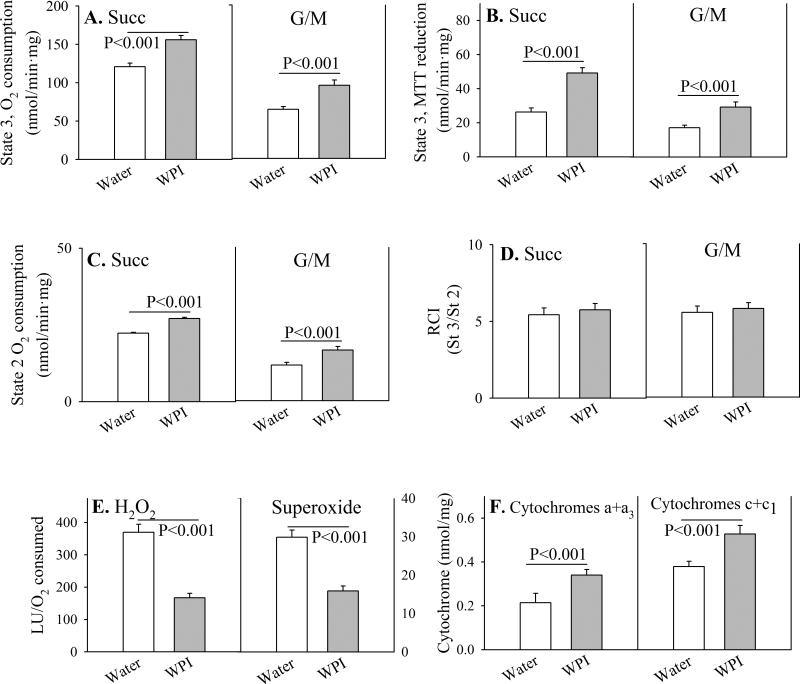
Fig. 2. Parameters of respiration in mouse brain mitochondria.
Control mice received plain drinking water (open bars) or WPI protein in drinking water (shaded bars) for 12 weeks. Respiration was measured in mitochondria isolated from mouse brain, measured under State 3 (substrate + 0.4 mM ADP; Panels A and B) and State 2 (substrate alone, ADP-limited; Panel C) conditions. The substrates were 3 mM glutamate + 3 mM malate (G/M), or 6 mM succinate (Succ). The Respiratory Control Index (RCI) as an estimate of energy coupling was calculated as the ratio of state 3/state 2 respiration (Panel D). The production of reactive oxygen metabolites H2O2 and O2, relative to oxygen consumption under state 2 conditions, is shown in Panel E. Levels of mitochondrial cytochromes a+a3 and c+c1 are shown in Panel F.
Data are shown as mean values ± SE (n=4 mice).
P-values are indicated for mean value differences between WPI mice and controls consuming plain water.

