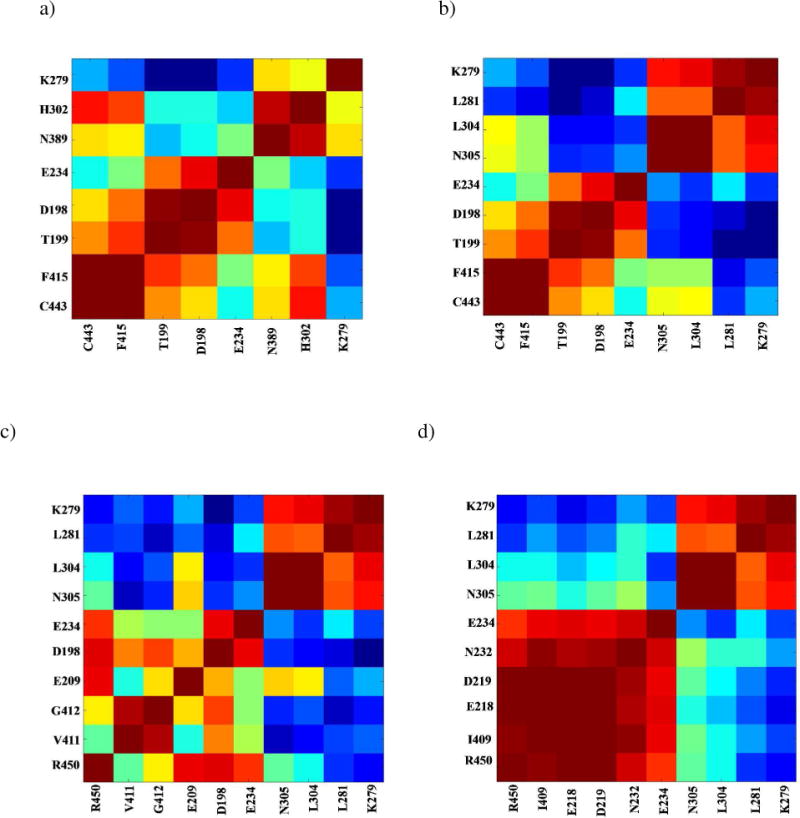
Figure 11.

Coupling of thermal motions between residues in various pathways. Cross-correlations in fluctuation between residue pairs in a) path I, b) path II, c) path III, and d) path IV, extracted from the C matrix of the MD simulation. A strongly correlated motion between residues is colored red, whereas strongly anti-correlated motions are colored blue.
