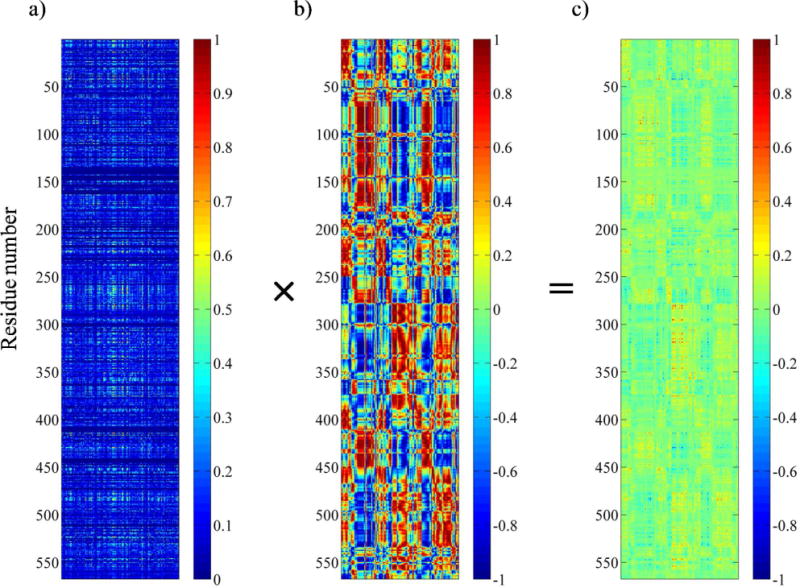
Figure 3.

Generation of coevolutionary dynamic coupling (CDC) matrix from SCA coupling matrix and truncated dynamic cross-correlation matrix. a) The unclustered SCA coupling matrix from the SCA of ProRS family. The X-axis represents the 152 perturbation sites, while the Y-axis corresponds to the 1–567 residues of the Ec ProRS. The color gradient, as indicated in the color bar, is as follows: blue squares represent the lowest and red squares represent the highest statistical coupling energies, . b) The truncated MD cross-correlation matrix generated by taking only those columns of perturbation sites (residues) that are present in the SCA matrix. The cross-correlation values range between +1 (correlated) to −1 (anticorrelated). c) The SCA•MD plot obtained as the CDC matrix by multiplying individual elements of the SCA matrix with the corresponding elements of the truncated MD matrix. Values range from +1.0 (co-evolved and thermally correlated) to −1.0 (co-evolved and thermally anticorrelated).
