
Figure 4.
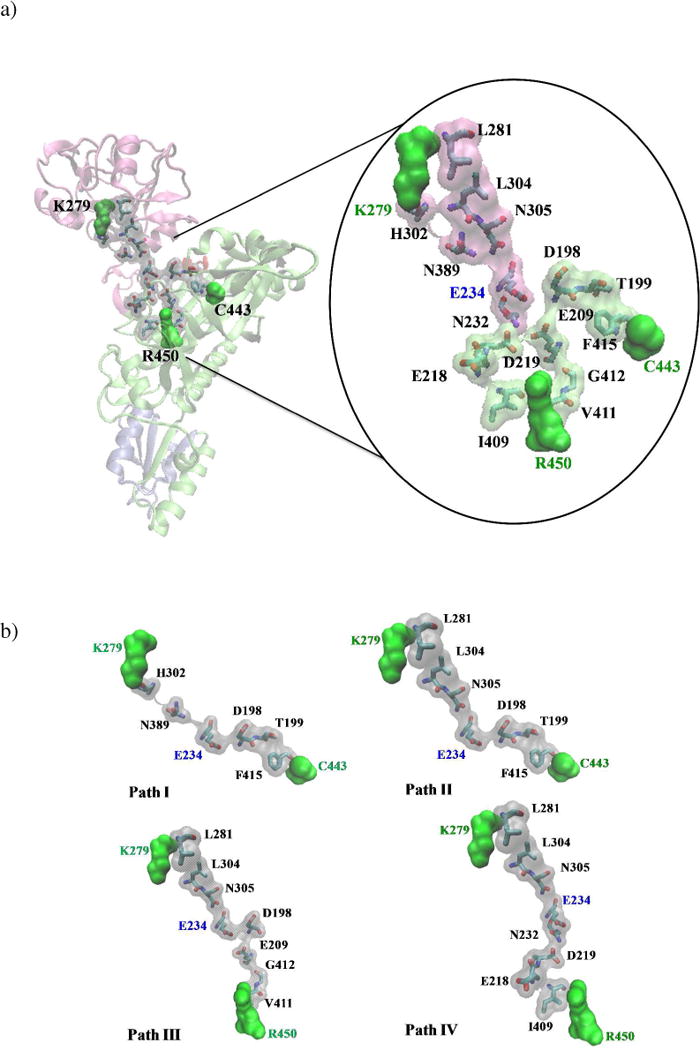
a) Representation of residue-residue interaction networks between the substrate binding domain (R450/C443) and the INS (K279) identified in this study. Terminal residues in the pathways are shown in green space-filling surface representation. b) Paths I – IV are shown in space-filling surface representations.