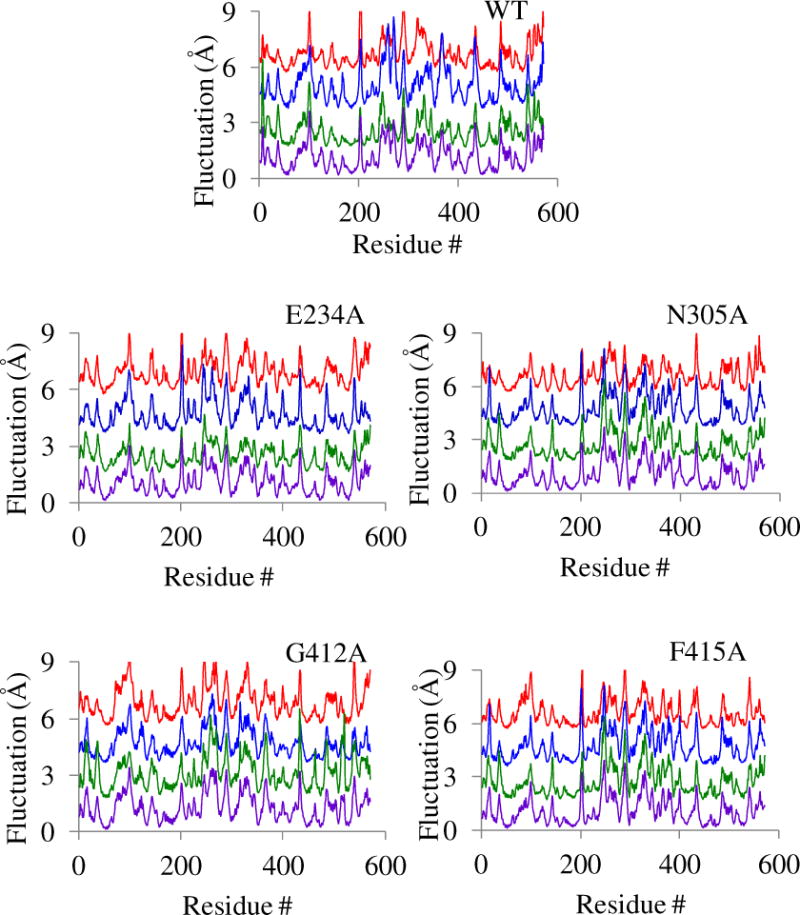
Figure 8.

Root-mean-square fluctuations of individual amino acids for WT ProRS and four variants. In each stacked plot, the RMS fluctuations of Cα atoms calculated from the time-averaged structures over the last 20 ns MD trajectories are shown. Fluctuations for the three replicas are separated by 2 Å and color coded for clarity; replica 1 (red), replica 2 (blue), and replica 3 (green). In each case the bottom plot (purple) represents the replica-averaged RMS fluctuations. The calculated propagated uncertainties are 0.3 Å for WT, 0.2 Å for E234A, 0.2 Å for N305A, 0.3 Å for G412A, and 0.3 Å for F415A.
