
Fig. 4. Distribution of mutations in two oncogenes (PIK3CA and IDH1) and two tumor suppressor genes (RB1 and VHL).
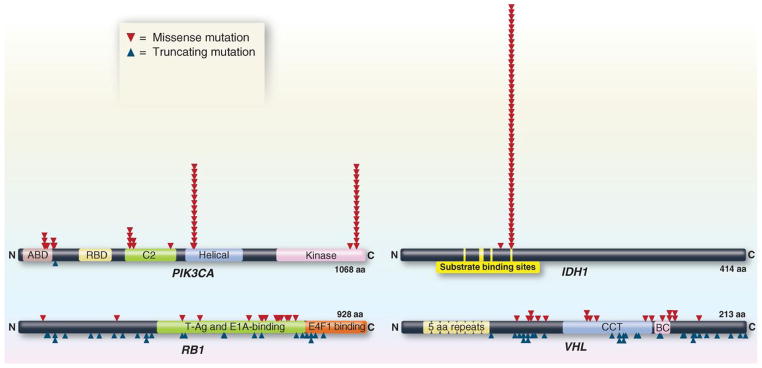
The distribution of missense mutations (red arrowheads) and truncating mutations (blue arrowheads) in representative oncogenes and tumor suppressor genes are shown. The data were collected from genome-wide studies annotated in the COSMIC database (release version 61). For PIK3CA and IDH1, mutations obtained from the COSMIC database were randomized by the Excel RAND function, and the first 50 are shown. For RB1 and VHL, all mutations recorded in COSMIC are plotted. aa, amino acids.