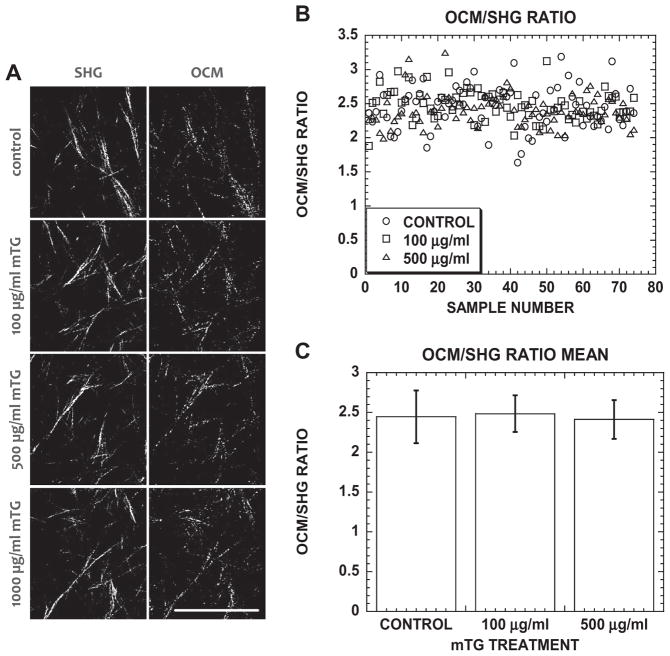
Fig. A2.
(A) Representative SHG and OCM images of acellular control and mTG-treated collagen gels. (B) Scatter plot of OCM/SHG ratio from 75 images in acellular control and mTG-treated collagen gels. (C) Bar graph of mean OCM/SHG ratio in acellular control and mTG-treated collagen gels. Error bars represent mean ± STD.

