Fig. 8.
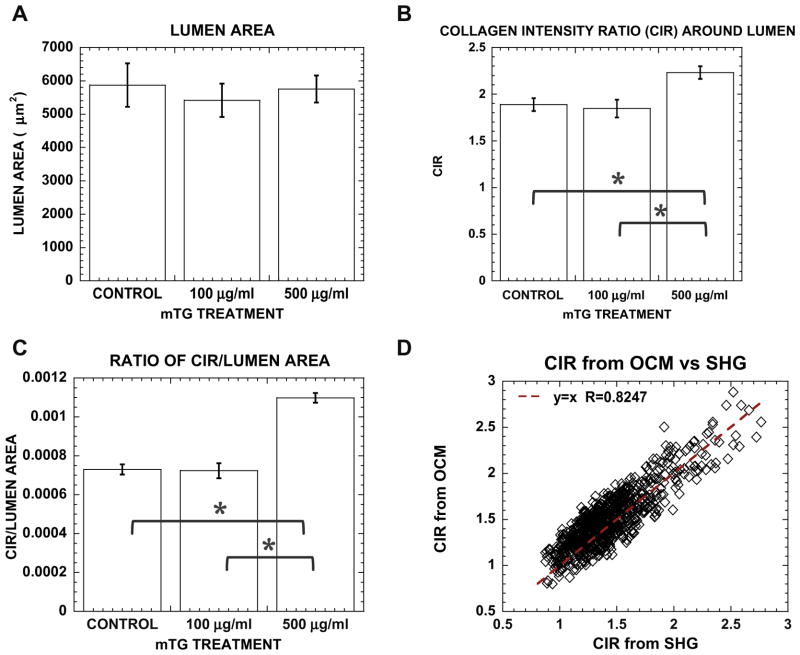
Greater matrix remodeling is observed during lumenogenesis in stiffer matrices. Bar graph of (A) lumen area, (B) lumenal CIR and (C) CIR normalized by lumen area in control and mTG-treated cultures. (D) Correlative plot of OCM and SHG derived CIR showing correspondence between linear and non-linear optical signals. Error bars represent mean ± SE. Sampling number n = 35, 25, 50 in (A, B) and n = 304, 218, 503 in (C) for control, 100 and 500 μgml−1 mTG, respectively. Symbol * represents P < 0.05.

