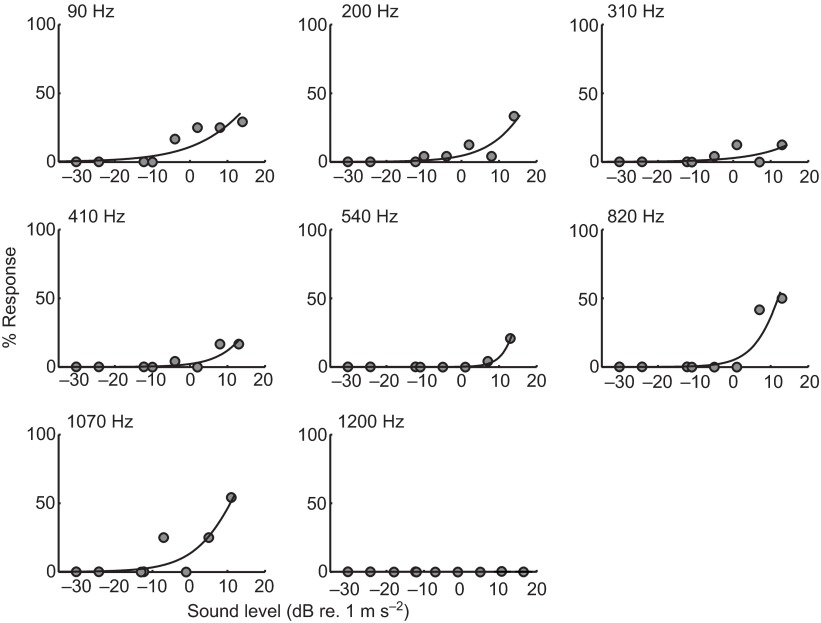
Fig. 5.
Representative examples of curve-fitting the acoustic startle percentage response at a given frequency at the various stimulus levels tested for 5–6 d.p.f. zebrafish. For each frequency, observed response percentages are shown as filled circles. The Weibull curve is fitted using an MLE criterion and threshold is characterized as the sound level (dB re. 1 m s−2; x-axis) at which the model predicts a response probability of 5% (y-axis).

