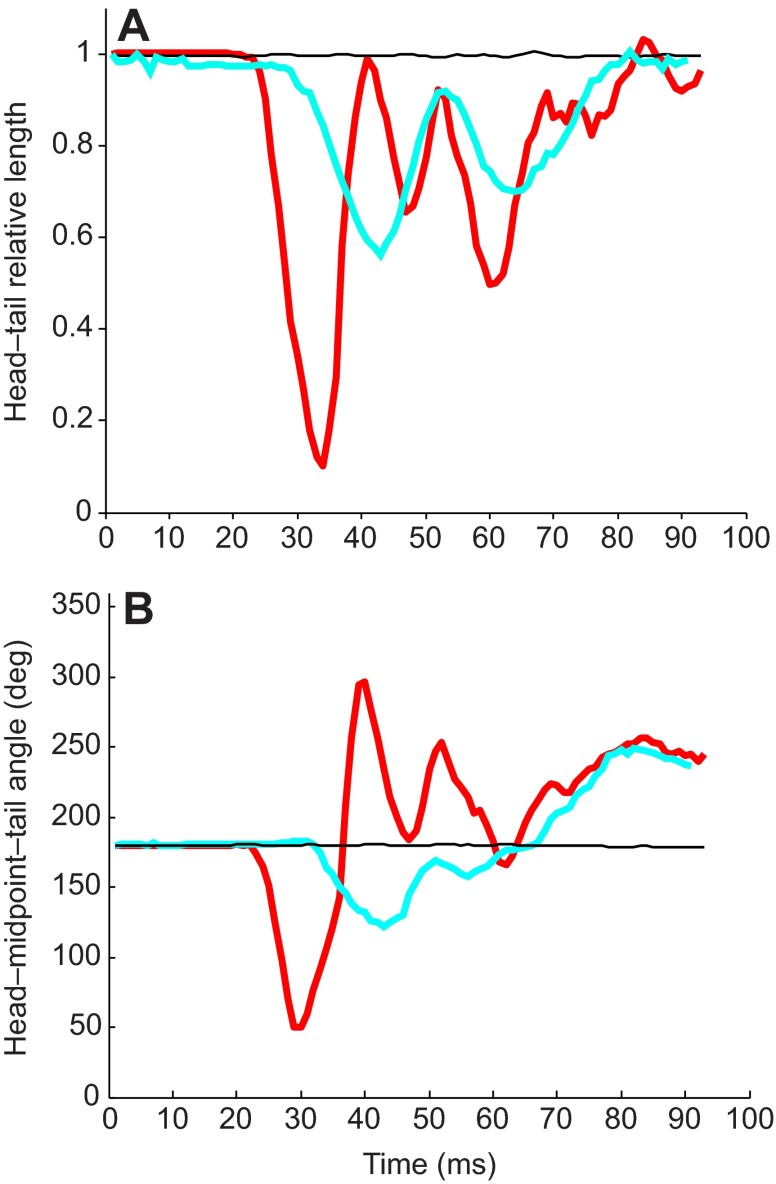
Fig. 6.
Example of the acoustic startle response characterization. (A) Euclidean length from head–tail throughout the response, relative to initial length. Time 0 denotes the onset of the stimulus. A positive startle response (red) shows a marked decrease in head–tail distance at the apex of the initial C-bend, followed by smaller refractory bends. The non-startle response (cyan) shows some decrease, but is smaller in magnitude than the startle. No response (black) is also shown. (B) Head–midpoint–tail angle throughout the response. Initial position is 180 deg. Length and angle measurements are highly correlated (r=0.83, N=18 responses).

