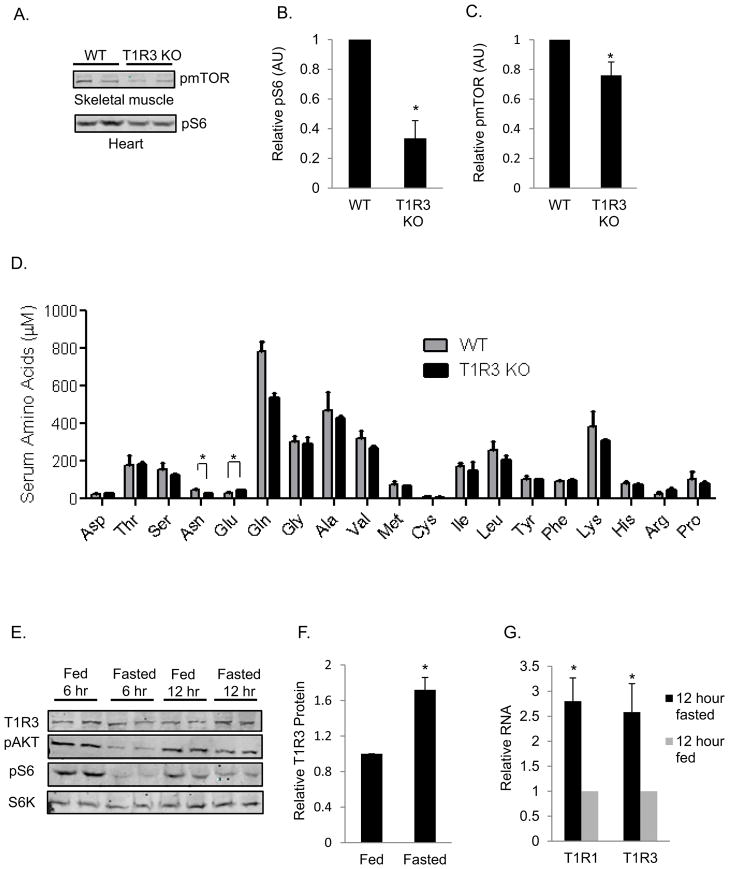
Fig. 4. mTORC1 activity is lower in tissues from T1R3−/− mice.
(A–D) C57BL/6J wild-type mice or T1R3 knockout mice were fasted 12–15 hr before sacrifice. (A) Immunoblots to detect pmTOR or pS6 from the indicated organs are shown. Refer to the S6K immunoblot in Figure 7I for protein normalization for the corresponding tissues. (B and C) Means of abitrary units of either pmTOR/S6K or pS6/S6K +/− SEM from 6 wild type and 6 T1R3 knockout mice. (D) AA concentrations were determined in serum isolated from mouse blood collected by cardiac puncture. Data are mean +/− SEM from 3 wild-type mice and 3 T1R3 knockout mice. (E–G) C57BL/6J mice were either fed or fasted for 12 hours before sacrifice. Protein and RNA were isolated from leg muscles for immunoblotting (E–F) and qPCR (G). Data are normalized to S6 protein (E and F) or 18S RNA (G), and means +/− SEM of a total of 6 fed and 6 fasted mice from three independent experiments. *, **, p < 0.05, and 0.01, respectively (two-tailed Student’s t-test). See also Figure S4.

