
Figure 5. Integrated analysis of F2 and AIL for startle, PPI and habituation.
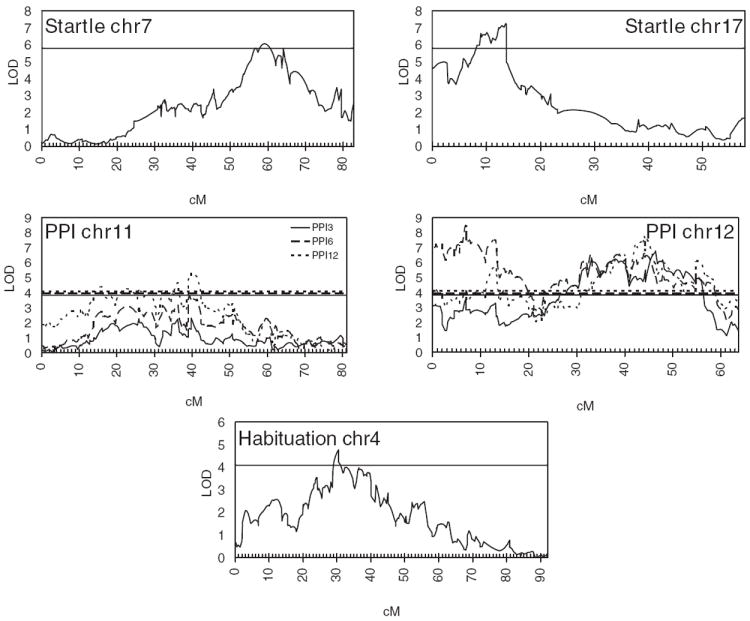
LOD scores are shown on the y-axis and genetic distance in cM is plotted on the x-axis. Horizontal lines indicate the genome-wide significance thresholds (P < 0.05).
Official websites use .gov
A
.gov website belongs to an official
government organization in the United States.
Secure .gov websites use HTTPS
A lock (
) or https:// means you've safely
connected to the .gov website. Share sensitive
information only on official, secure websites.
LOD scores are shown on the y-axis and genetic distance in cM is plotted on the x-axis. Horizontal lines indicate the genome-wide significance thresholds (P < 0.05).