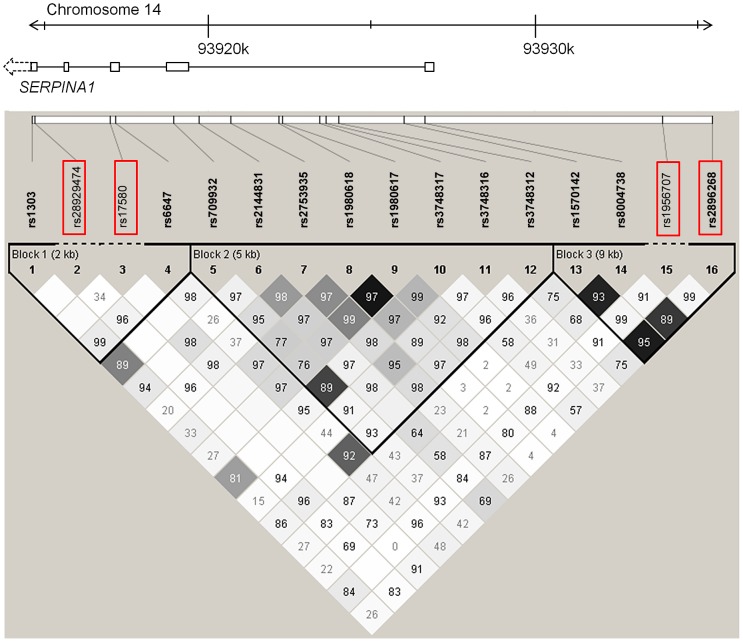
Figure 4. LD plot among common and low-frequent SNPs in the SERPINA1 gene within the SAPALDIA study.
Shading represent r2 values, whereas numbers represent D′ values (no number equals D′ = 1). Red framed SNPs are independently associated with AAT serum levels after forward selection stepwise regression modeling. Rs17580 is the PI S variant and rs28929474 is the PI Z variant.

