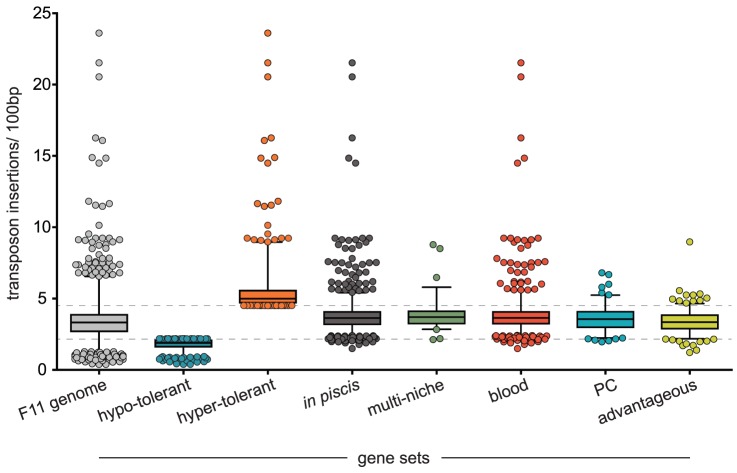
Figure 2. Transposon insertion rates for loci within different gene sets.
From each input pool (1, 2 and 3) an average number of insertions detected per 100 bp was calculated for each annotated region within the F11 genome. Box plots indicate median and interquartile ranges with whiskers extending to the 1st and 99th percentiles. Dashed lines mark the upper and lower boundaries for hypo and hyper-tolerant gene sets, respectively. Gene set sizes: F11 genome - 5,312; hypo-tolerant - 609; hyper-tolerant - 431; in piscis - 970; multi-niche - 76; blood - 772; PC - 122; advantageous - 227. Note, the insertion rates reported here are expected to be overestimated—please refer to Methods section ‘Candidate Identification’ for a complete description of how the number of transposon insertion events was determined.

