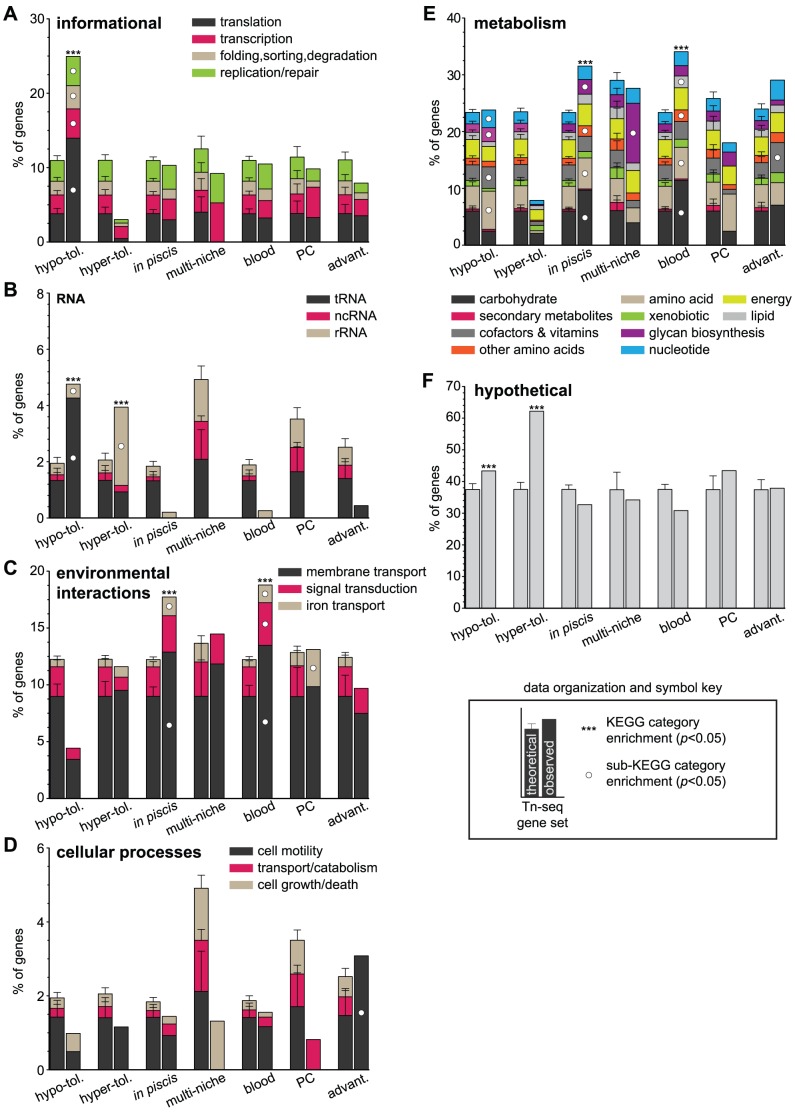
Figure 3. Functional KEGG categories enriched within gene sets.
To orient the reader to graph organization and symbols, a key is provided in the lower right corner. The cumulative percent of genes (y-axis) within each Tn-seq-derived gene set (x-axis) belonging to the functional categories (A) informational, (B) RNA (C) environmental interactions, (D) cellular processes, (E) metabolism and (F) hypothetical is depicted. The proportion of genes contributed by specific sub-KEGG categories is represented by stacked elements within each column. Significant enrichments for KEGG and sub-KEGG categories are denoted with asterisks and white circles, respectively. Gene set abbreviations: hypo-tol. = hypo-tolerant; hyper-tol. = hyper-tolerant; advant. = advantageous. Theoretical KEGG category compositions for Tn-seq gene sets and p values were determined using 10,000 Monte Carlo simulations (Methods).

