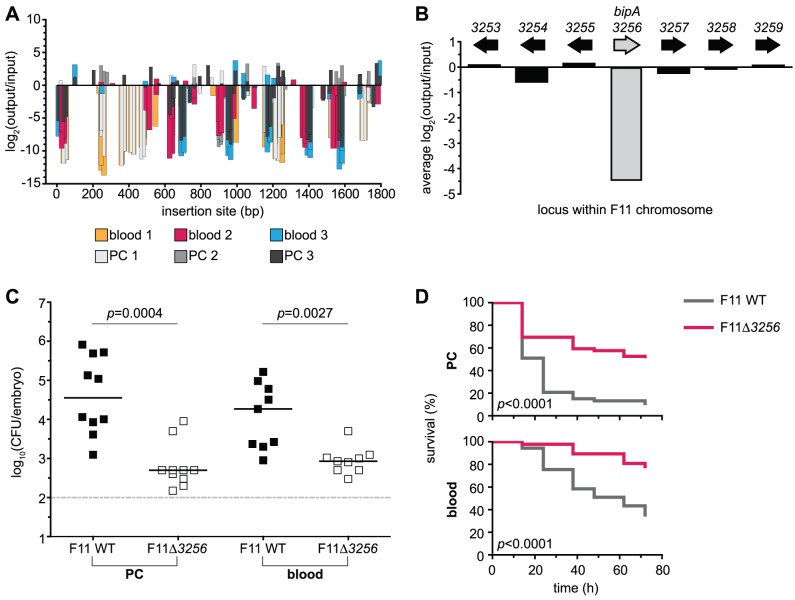
Figure 4. Retrospective deletion of the candidate gene EcF11_3256/bipA confirms Tn-seq as a useful tool for the identification of loci required for fitness and virulence.
(A) Inserts found within the locus EcF11_3256/bipA are plotted with respect to their position of integration (x-axis). Magnitude and direction of bars represent the change in fitness of F11 (y-axis) that correlated with a given insertion event. Color of bars denotes pool of origin. Changes in fitness are presented as log2 of the ratio of occurrence frequencies observed between output and input pools (output/input). (B) The average of insert-based fitness changes in (A) is plotted on the x-axis (shaded bar, bipA). For comparison, the average alterations in occurrence frequency ratios for proximal genes are also plotted. (C) Equal numbers (1,000–2,000 CFU total) of wild type and F11Δ3256 were inoculated into the PC (left) or bloodstream (right) of zebrafish embryos. Fish were sacrificed and bacterial loads enumerated ∼20 h post-inoculation by differential plating (n = 9 to 10 zebrafish). Dashed line marks the limit of quantification; p values were determined using a paired t-test, bars indicate medians. (D) The pericardial cavity (PC, top) and blood (bottom) of 48 hpf embryos were inoculated with approximately 3,000 CFU. Fish were scored for death at 0, 12, 24, 36, 48, 60 and 72 h post-inoculation (hpi). Data are presented as Kaplan-Meier survival plots and p values were calculated using a log-rank (Mantel-Cox) test (n>45 for each survival curve).

