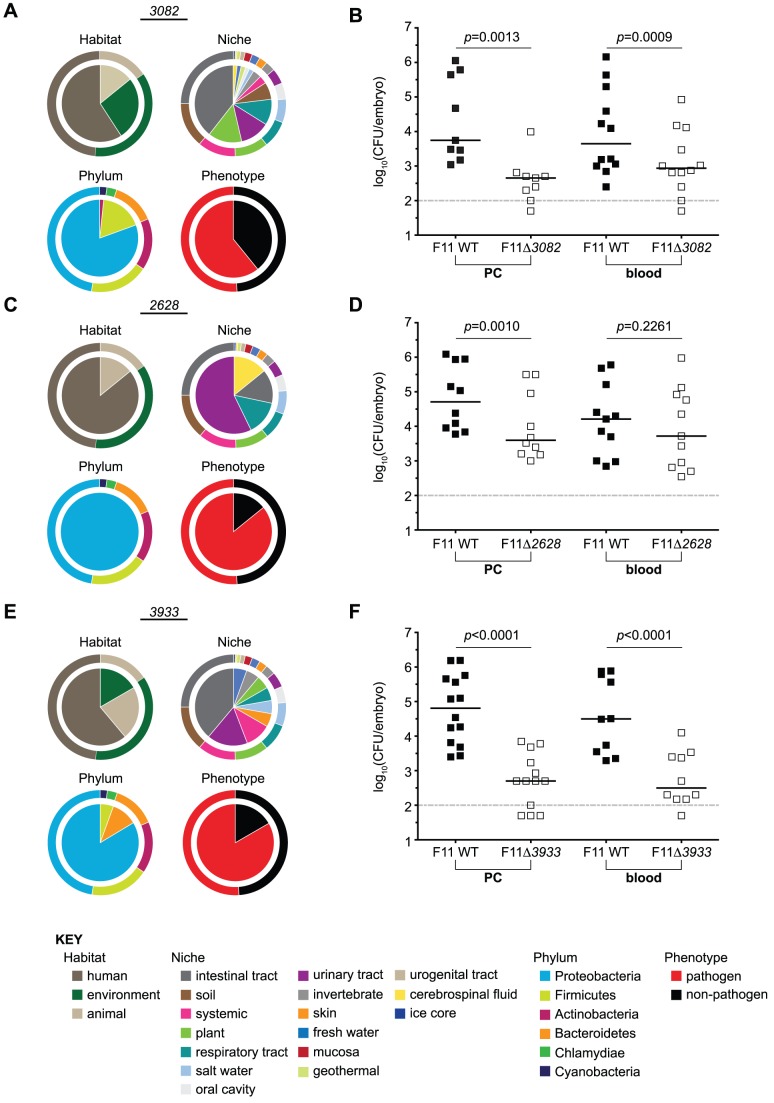
Figure 6. Targeted deletion of candidate genes with pathogenic identity attenuates the fitness of F11 within zebrafish.
The composition of traits (bottom KEY) represented among bacteria encoding homologues of (A) EcF11_3082, (C) EcF11_2628, or (E) EcF11_3933 are presented for the trait categories habitat of isolation, niche of isolation, phylum and phenotype. For reference, segmented outer rings bordering each pie graph depict the composition of traits of all genes contained within the TEA-MD. Equal numbers (1,000–2,000 CFU total) of wild type and (B) F11Δ3082, (D) F11Δ2628, or (F) F11Δ3933 were inoculated into the PC (left) or bloodstream (right) of embryos. Fish were sacrificed and bacterial counts determined ∼20 h post-inoculation by differential plating (n = 9 to 14 zebrafish). Dashed line marks the limit of quantification; p values were determined using a paired t-test, bars indicate medians.

