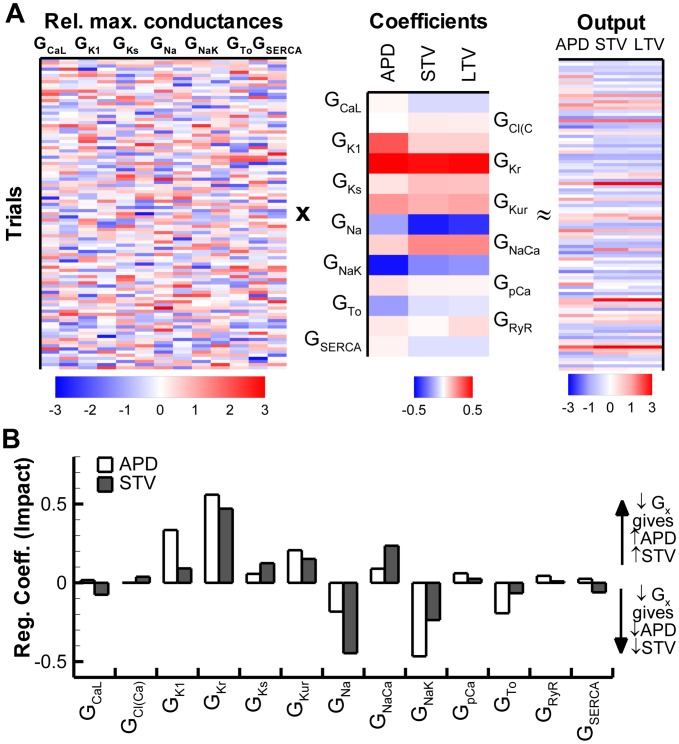
Figure 3. Contribution of currents to BVR determined via linear regression of 200 unique virtual myocytes.
A. Relative changes in the maximal conductance (Gx) of the 13 currents/fluxes (lanes correspond to the column pairs in panel B) for 100 (out of 200) trials (left panel) and corresponding changes in outputs (APD, STV and LTV) during steady-state pacing at CL = 1000 ms (right panel). Middle panel shows the coefficients that indicate the contribution of each current to every output measure as determined via linear regression. B. Bar plot of the magnitude of the coefficients from panel A regarding their impact on APD (white bars) or STV (shaded bars). IKr and INa have a large impact on both APD and BVR, consistent with the results from Figure 2 . In addition, INaK also strongly affects STV. LTV showed similar pattern as STV and is not shown for clarity.

