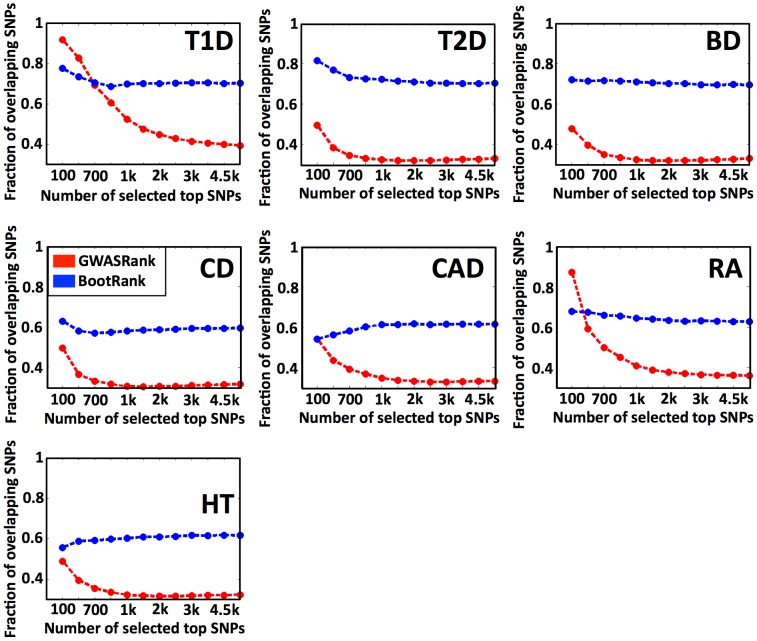
Figure 1. Fraction of intersection of filtered SNPs lists between different cross-validation partitions.
For each disease (T1D, Type 1 diabetes; T2D, Type 2 diabetes; CD, Crohn's disease; CAD, coronary artery disease; BD, bipolar disorder; RA, rheumatoid arthritis; HT, hypertension), shown is the mean fraction (y-axis) of top SNPs shared between training sets from different cross-validations when ranking SNPs by GWASRank (red) or BootRank (blue). The x-axis shows the number of SNPs that were selected as top SNPs from the SNP ranking.

