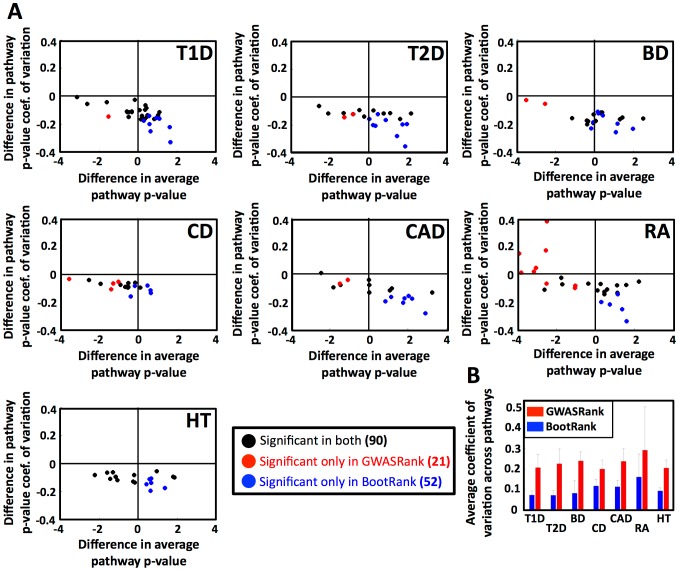
Figure 2. BootRank reduces noise in p-value pathway enrichment scores and detects more enriched pathways.
(a) For each disease (T1D, Type 1 diabetes; T2D, Type 2 diabetes; CD, Crohn's disease; CAD, coronary artery disease; BD, bipolar disorder; RA, rheumatoid arthritis; HT, hypertension), shown are the differences in the average (x-axis) and coefficient of variation (y-axis) of the enrichment p-values of all significantly enriched KEGG pathways. (b) The mean noise (measured as coefficient of variation) of pathway enrichment p-values are shown for all diseases for GWASRank (red) or BootRank (blue).

