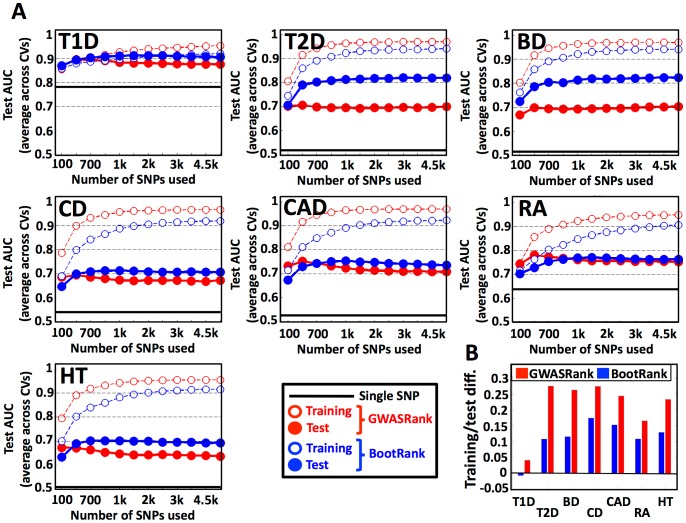
Figure 3. BootRank improves disease risk prediction for held-out test individuals.
(a) For each disease (T1D, Type 1 diabetes; T2D, Type 2 diabetes; CD, Crohn's disease; CAD, coronary artery disease; BD, bipolar disorder; RA, rheumatoid arthritis; HT, hypertension), shown are the training (empty circles) and test (filled circles) AUC values as a function of different numbers of SNPs used in the model (x-axis) when employing either GWASRank (red) or BootRank (blue) to rank SNPs. (b) The mean difference between training AUC and test AUC is shown for all diseases for GWASRank (red) or BootRank (blue).

