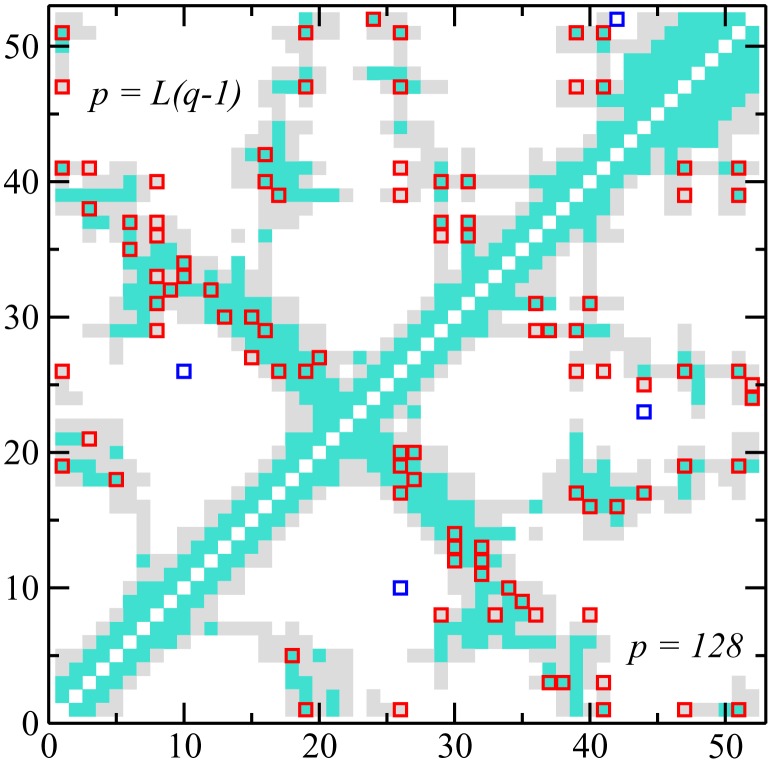
Figure 5. Contact map for the PF00014 family.
Filled squares represent the native contact map on the 3D fold (PDB 5pti, with turquoise squares signaling all-atom distances below 5 Å, and grey ones distances between 5 Å and 8 Å). The 50 top predicted contacts with minimal separation of 5 positions along the sequence ( ) are shown with empty squares: true-positive predictions (distance
  Å) are colored in red, and false-positive predictions in blue. Predictions are made with the Hopfield-Potts model with
  patterns (bottom right corner) and with
  patterns (DCA, top left corner). For both values of
  there are 48 true-positive and 2 false-positive predictions.

