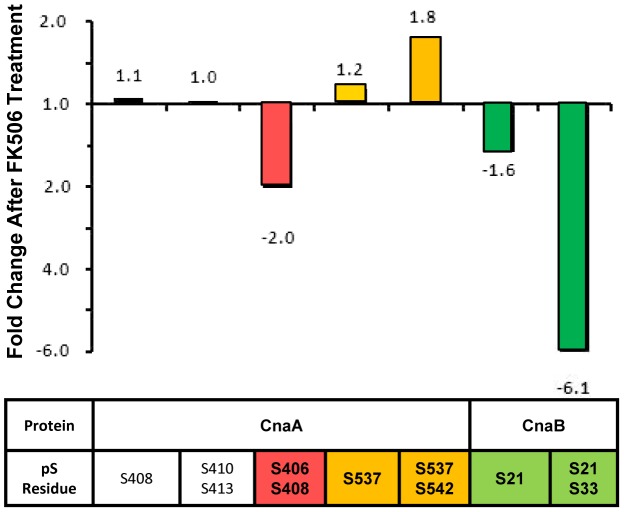
Figure 6. FK506 affects the phosphorylation of Calcineurin complex in vivo.
Relative fold changes abundance values of individual phosphorylated residues within CnaA and CnaB following TiO2 enrichment and LC-MS/MS analysis. Following manual extracted ion chromatogram generation (+/−20 ppm tolerances) of each individual phosphopeptides, peak heights were used to determine abundance, which was subsequently compared across +/− FK506 treated samples. A peak was considered as belonging to the same group across the different samples if it was the same m/z (+/−10 ppm), had the same retention time (+/−30 seconds), and was qualitatively identified as the same species. Raw extracted ion chromatographic peak heights are presented in Supplemental Figures S6 and S7.

