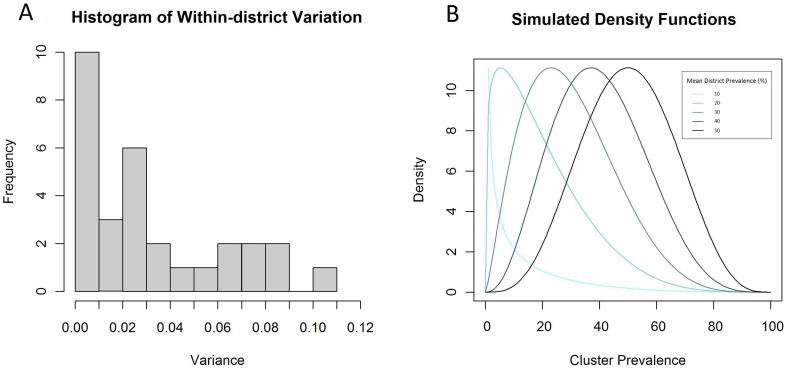
Figure 1. Histogram of the district variance of TF in Kenya (A) and density functions used to simulate data (B).
Variance in the prevalence of active trachoma was quantified within 29 districts in Kenya. The mean within-district variance was then used to inform beta density functions for simulating cluster-level prevalence values for varying district level prevalence values.

