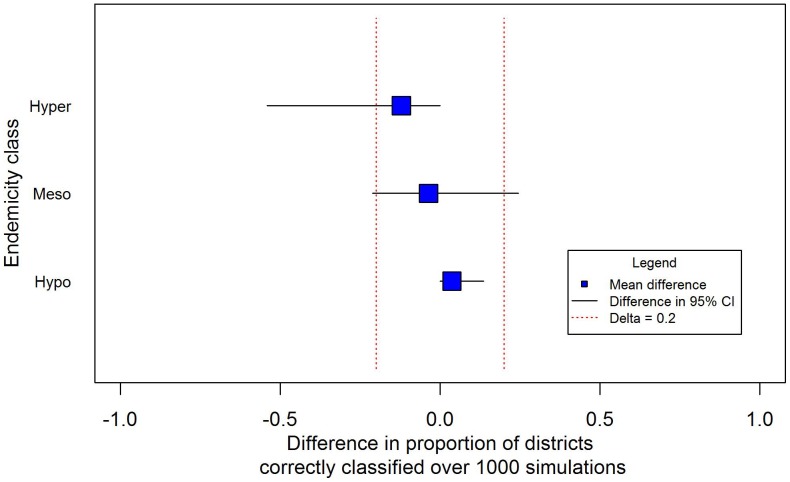
Figure 4. Equivalence of ITM compared to CRS by endemicity class.
The figure presents the difference in the proportion of times ITM correctly classified districts compared to CRS (over 1000 simulations) by endemicity class in relation to an assumed value (20%) representing an important programmatic difference. The blue square is the mean difference in proportions and the lines correspond to the difference in the 95% CI. The two methods are deemed equivalent when ITM correctly classifies districts differently to CRS no more than 20% of the time.

