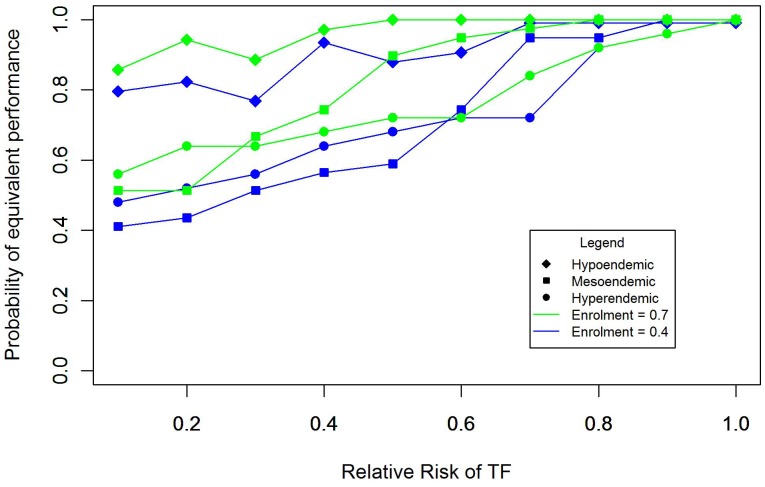
Figure 5. Equivalence in district classification by ITM and CRS.
Equivalence is determined by calculating the difference in the probabilities that CRS and ITM will correctly classify a given district over 1000 simulations, and estimating whether this difference exceeds a delta equal to 0.2, signifying that two methods classify districts differently no more than 20% of the time. The figure presents equivalence by endemicity class and relative risk of TF in enrolled and non-enrolled children, where enrolment is equal to 0.4 (blue) or 0.7 (green).

