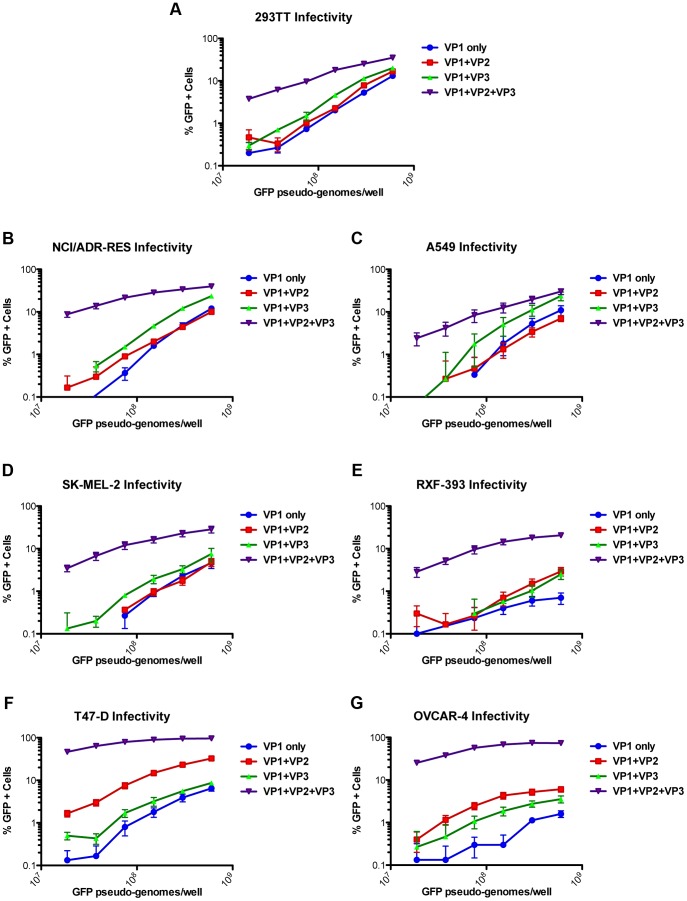
Figure 5. Effect of the VP2 and VP3 proteins of BKV on pseudovirus transduction.
Transduction of different cell lines (A–G) by BKV pseudoviruses produced with the gene for VP1-only, VP1+VP2, VP1+VP3, or VP1+VP2+VP3 was analyzed by flow cytometry. The average percentage of GFP-positive cells from three experiments is shown and error bars represent the standard error of the mean.

