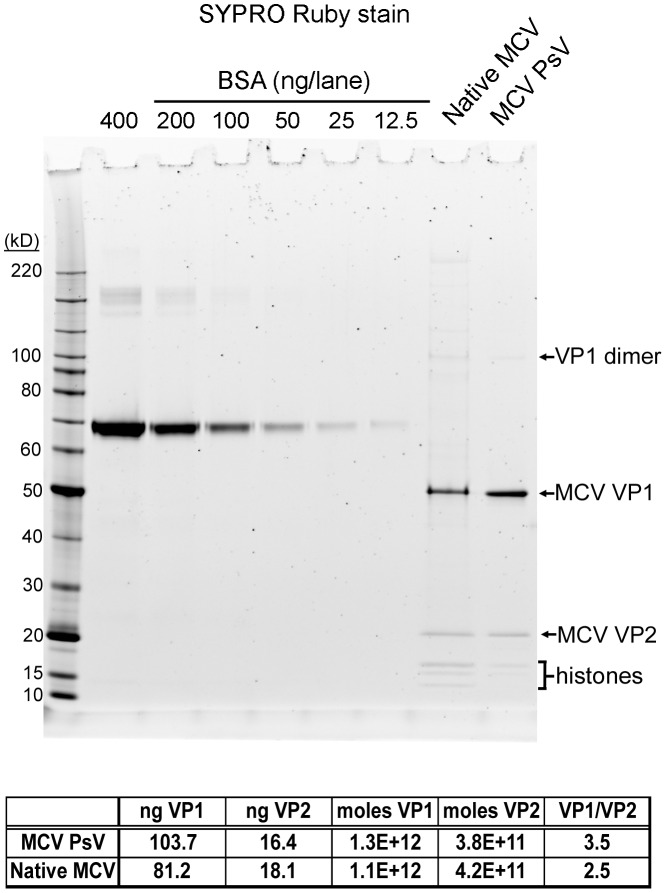
Figure 7. The ratio of VP1 to VP2 in MCV pseudovirions and native virions.
BSA standards, MCV pseudovirions, and WT native MCV virions were analyzed by SDS-PAGE and SYPRO Ruby protein stain. A standard curve was created with density measurement of BSA standards and used to calculate estimates of VP1 and VP2 protein concentration. The table below the graph shows the result of these calculations.

