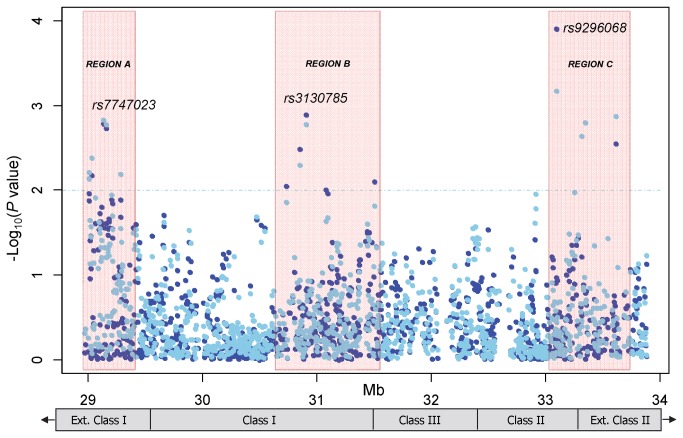
Figure 1. Analysis of 1,145 SNPs across a 4 Mb region of the extended major histocompatibility complex and risk of childhood BCP-ALL.
Presented are -log10(p-values) resulting from the logistic regression analysis assuming log-additive (navy blue) and dominant (light blue) genetic models of inheritance and adjusting for child’s age, sex, and race/ethnicity. Results plotted above the dotted line represent nominal p-values of less than 0.01. Analyses evaluating the recessive and genotypic genetic models were also performed (not plotted) resulting in five additional SNPs with a nominal p-value of less than 0.01 which were also located within one of the three designated regions (Regions A-C). A total of 20 SNPs with a p-value below this threshold were considered in further analyses.

