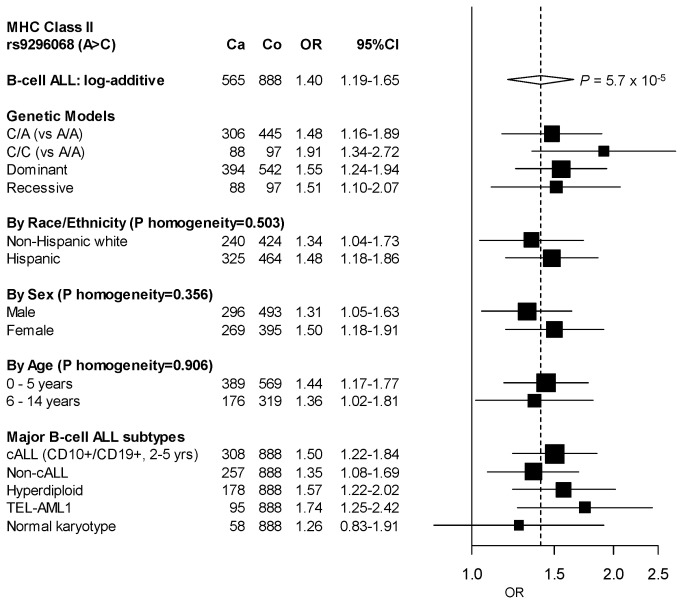
Figure 2. Stratified analysis of childhood BCP-ALL and the SNP rs9296068 by race/ethnicity, sex, and age group, and subgroup analyses by major subtypes.
Odds ratios (ORs, represented by boxes with the area of each box inversely proportional to the variance of the estimate) and 95% CI (error bars) were derived using logistic regression assuming a log-additive genetic model and adjusting for rs7747023, rs3130785, rs1632856, rs2524279, and rs213203 (other potentially associated SNPs presented in Table 1) and additionally for child’s age, sex, and race/ethnicity based on the stratification variable. The dashed vertical line represents the OR of the SNP in the analysis of BCP-ALL among all subjects and the width of the diamond is the corresponding 95% CI. P homogeneity was on the basis of the Cochran’s Q test statistic. Abbreviations: Ca, number of case; cALL, common acute lymphoblastic leukemia; Co, number of controls.

