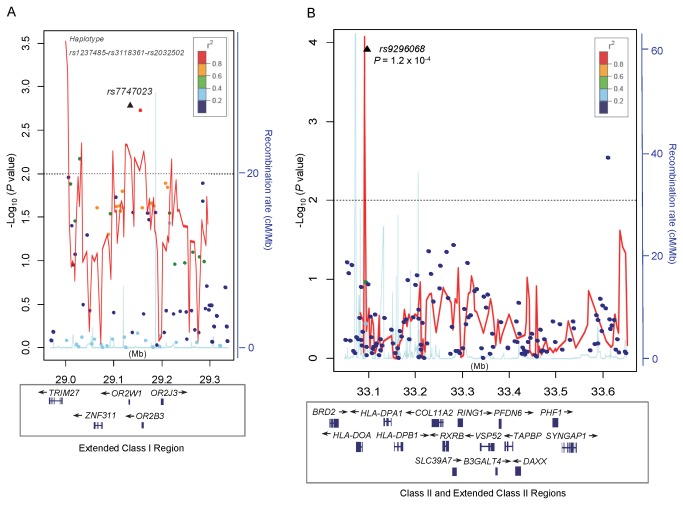
Figure 3. Plots of the two associated loci showing the results for the analysis of childhood BCP-ALL and individual SNPs (points) and three-SNP sliding window haplotypes (red lines).
The -log10 (p-values) for each SNP (y-axis) are plotted against their chromosomal position (x-axis, Mb). The colors of the points indicate the degree of linkage disequilibrium (based on r 2) in relation to the index SNP (indicated by a black triangle). Results of the global likelihood ratio test of each three-SNP sliding window haplotype analysis are plotted and connected by the red lines. The plotted lines in blue are recombination rates (cM/Mb) based on HapMap Phase I and II data (http://hapmap.ncbi.nlm.nih.gov). A) Region A is indexed by rs7747023 as the strongest associated SNP. A statistically significant haplotype comprising rs1237485, rs3118361, and rs2032502 located adjacent to TRIM27 was found to be associated with childhood BCP-ALL. B) Region C is indexed by a statistically significant SNP, rs9296068, located near HLA-DOA. A three-SNP haplotype containing rs9296068 was significantly associated with childhood BCP-ALL.

