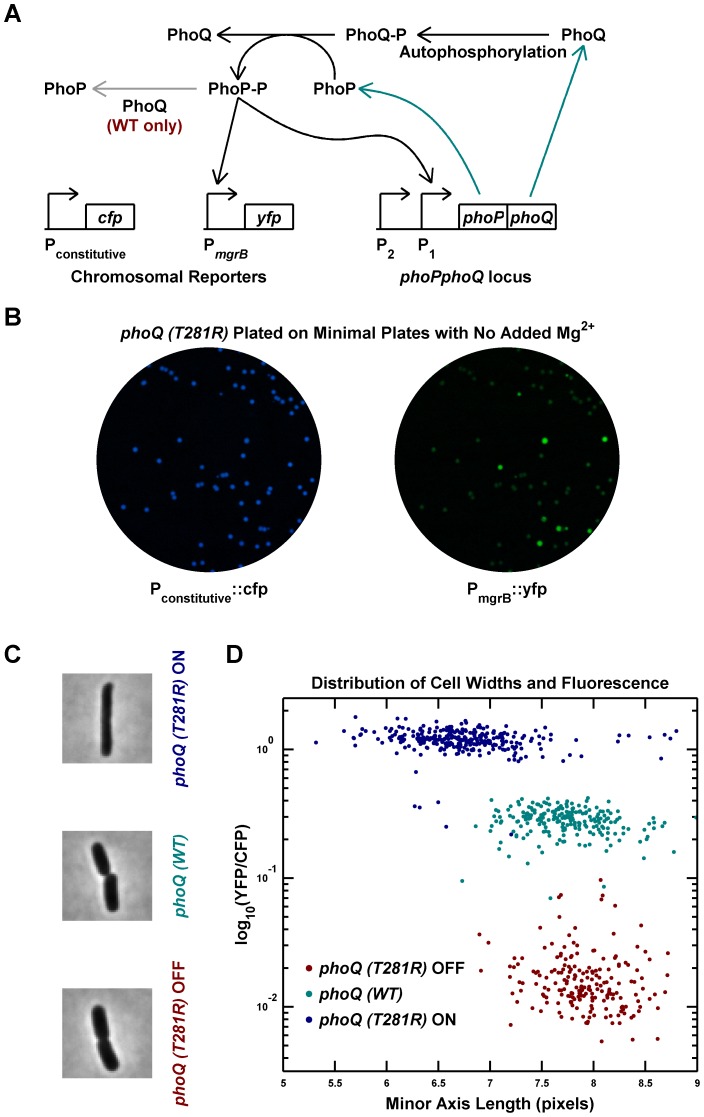
Figure 1. Phenotypic bimodality and hysteresis in the phoQ (T281R) mutant.
(A) Schematic of the PhoQ/PhoP circuit. The phoPQ operon in transcribed and translated to produce PhoP and PhoQ proteins (cyan arrows). Post-tranlational interactions between PhoQ and PhoP generate PhoP-P, which upregulates the expression of the phoPQ operon and the yfp reporter (solid black arrows). The PhoQ phosphatase activity, which is absent in PhoQ (T281R), is depicted with a gray arrow. (B) Bimodal behavior of YFP colony fluorescence. Panel shows CFP and YFP channel images of a minimal medium plate on which an LB overnight culture of the phoQ (T281R) strain was spread. (C and D) Phenotypic hysteresis. Overnight cultures of phoQ (WT), phoQ (T281R) OFF, and phoQ (T281R) ON strains in LB were diluted 1000-fold into Minimal A medium with 100 µM Mg2, grown to mid-exponential phase and imaged by fluorescence microscopy (Methods). The PhoP-P state of the cell was determined by measuring YFP expression driven by the PhoP-P responsive mgrB promoter and normalized to CFP expression driven by a constitutive promoter. Cell widths were quantified by fitting phase image masks to ellipses and computing the minor axis length. Representative phase images of the three strains are shown in panel C and reveal morphological differences between OFF and ON cells. Fluorescence and cell width values for each cell are plotted in panel D with indicated colors distinguishing the three strains. Note that phoQ (T281R) OFF cells (maroon) have much lower fluorescence and are wider than phoQ (T281R) ON cells (blue).

