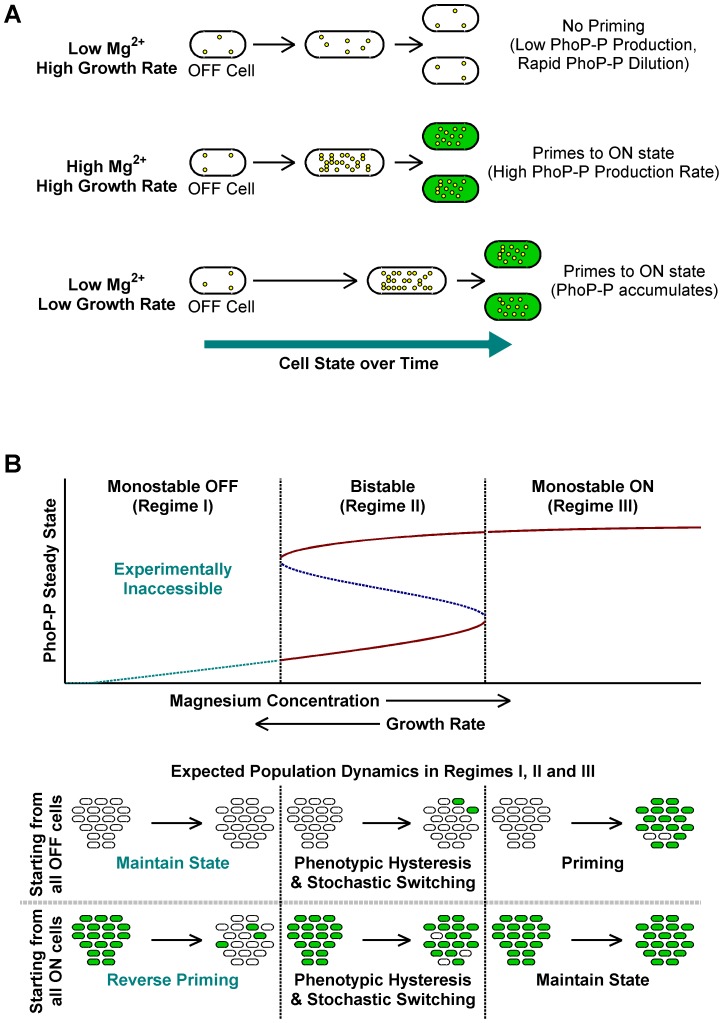
Figure 3. A conceptual framework for priming.
(A) Typical fates of OFF cells under different growth conditions. Yellow circles within cells represent PhoP-P molecules. High Mg2+ and slow growth rates lead to higher PhoP-P concentrations, which result in conversion of OFF cells to the ON state. (B) Stochastic switching and priming. Typical plot obtained by varying system parameters such as kinase rate, maximal expression rate or growth rate in a mathematical model of the phoQ (T281R) network (Text S1) is shown. Steady state PhoP-P values are depicted as a function of the system parameter being varied and the plot can be categorized into three distinct regimes as indicated. Stable OFF and ON state PhoP-P values are plotted in solid maroon. Dashed, blue line represents the unstable intermediate state in the bistable regime. Experimentally inaccessible monostable OFF steady states are shown with a dashed, cyan line. The empirically observed effect of changing magnesium concentrations and growth rate is indicated below the x-axis of the plot. Expected fates of pure OFF and pure ON populations in the three regimes are also illustrated (bottom). The bistable regime is characterized by phenotypic hysteresis and stochastic state switching, whereas priming would be seen in the monostable ON regime.

