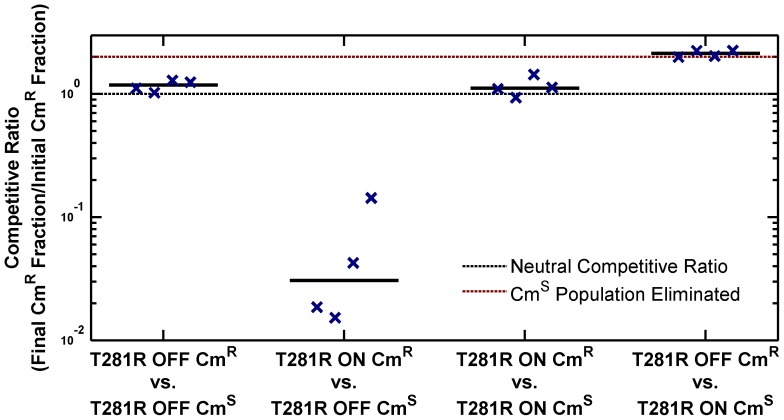
Figure 4. ON cells have a competitive disadvantage in stationary phase in LB.
Overnight cultures of chloramphenicol-sensitive (CmS) and chloramphenicol-resistant (CmR) variants of phoQ (T281R) OFF and phoQ (T281R) ON were set up independently in LB. For each competition experiment, 1 ml of CmS and CmR overnight cultures were mixed and co-cultured for an additional 10 hours in stationary phase. Initial and final total and CmR populations were quantified by plating appropriate dilutions on LB and LB+chloramphenicol plates (see Figure S3 for a detailed protocol). Colony counts were used to compute a competitive ratio (CR), defined as CR = (C(10)L(0))/(C(0)L(10)), where C(T) and L(T) denote the counts on chloramphenicol and LB plates at time T respectively. Note that CR is different from the competitive index (CI) that is frequently used to quantify the outcome of competition experiments (CI is the quotient of final and initial ratios of the population of the two competing strains). In our experimental design, CR has an upper bound of ∼2, whereas CI is, in principle, an unbounded quantity. In competitions between CmS ON and CmR OFF cells, the final CmS population is below the detection limit and CI cannot be computed. Symbols indicate CR values obtained from 4 independent competition experiments. The solid, black line represents the median. Dashed, black line indicates a neutral competitive ratio of 1. Note that a CR of 2 (dashed, maroon line) corresponds to a near-elimination of the CmS population.

