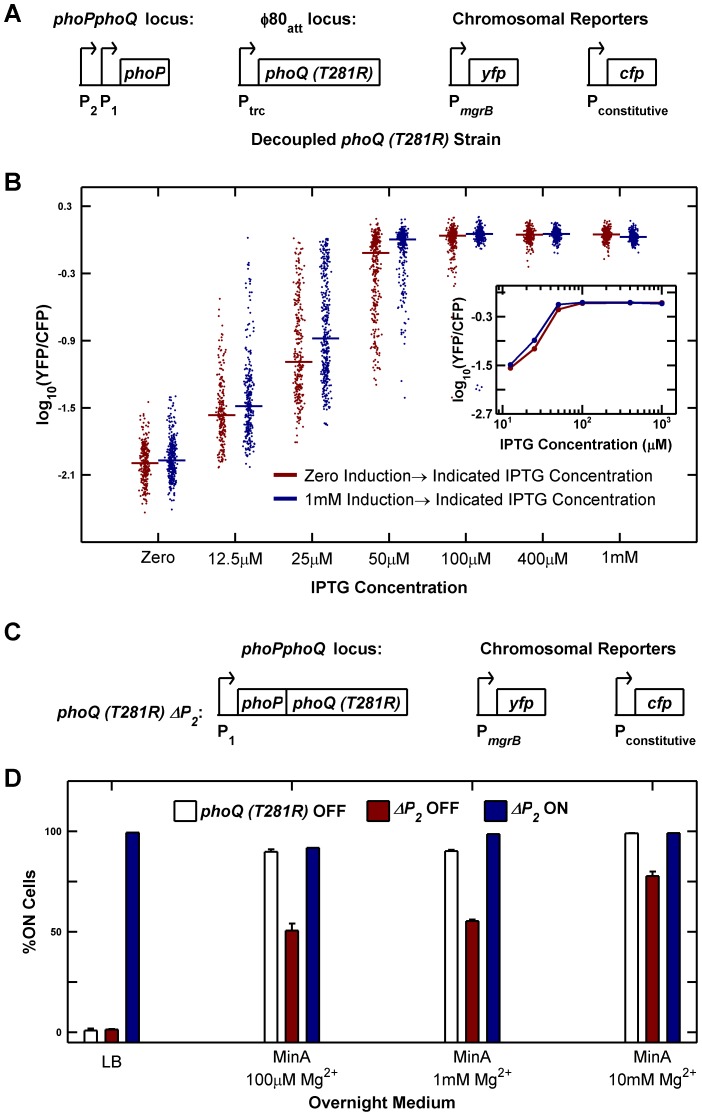
Figure 6. Architectural features of the PhoQ/PhoP network that govern bistability and priming.
(A and B) Decoupling of phoQ (T281R) expression from PhoP-P control results in loss of bistability. Panel A is a schematic of the decoupled phoQ (T281R) strain. phoP is driven by its native promoters: the constitutive P2 and the PhoP-P responsive P1 promoters, whereas expression of phoQ (T281R) is governed by the PhoP-P independent, IPTG-inducible Ptrc promoter. Uninduced and fully induced cultures of the decoupled strain were washed twice in minimal medium without IPTG, diluted 105-fold into Minimal A medium containing 100 µM Mg2+ with indicated IPTG concentrations, grown to mid-exponential phase and imaged under a microscope (Methods). YFP/CFP distributions at various induction levels are shown in panel B. For each sample, the median value of YFP/CFP is represented as a horizontal line. Samples derived from uninduced and fully induced cultures are plotted in maroon and blue respectively. Inset shows the median YFP/CFP value as a function of IPTG concentration for samples derived from the induced (blue) and uninduced (maroon) cultures. (C and D) Deletion of the constitutive P2 promoter of the phoPQ operon reduces priming. Panel C is a schematic of the ΔP2 strain in which the constitutive P2 promoter of the phoPQ operon had been deleted. Overnight cultures of phoQ (T281R) OFF, ΔP2 OFF, and ΔP2 ON strains in indicated medium at 37°C were diluted 1000-fold into Minimal A medium with 100 µM Mg2+, grown to mid-exponential phase and imaged under a microscope (Methods). The percentage of ON cells in the images is plotted in panel D. Error bars indicate half the range of two independent experiments. The range is less than 0.5% in the instances where error bars are not visible.

