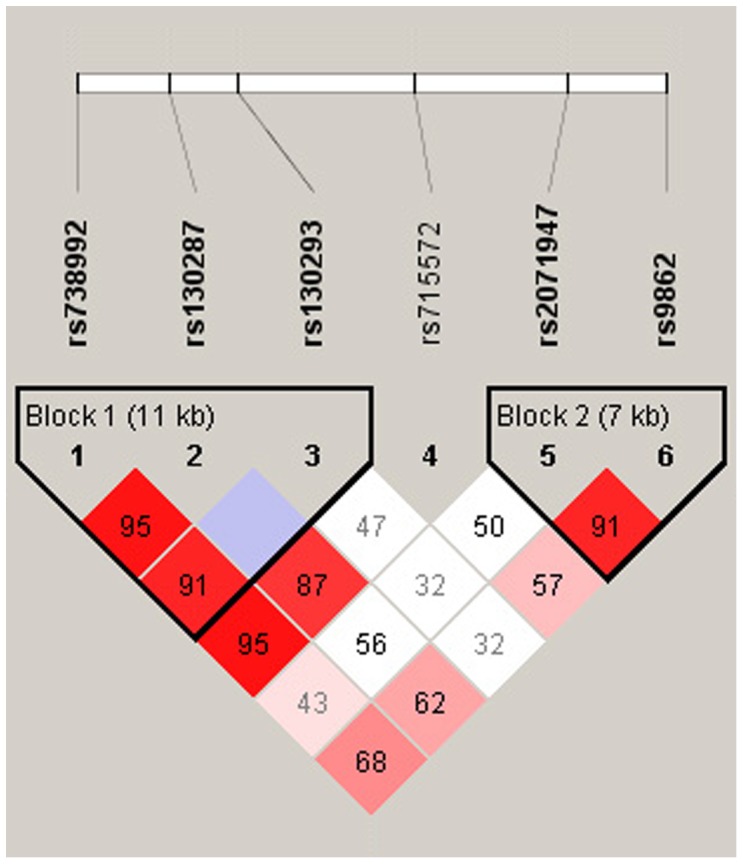
Figure 1. Linkage disequilibrium (LD) plot of six SNPs of the TIMP3 gene.

LD plots were prepared from both subject groups; D’ values that correspond to SNP pairs are expressed as percentages and are shown within the respective squares. Higher D’ values are indicated with a brighter red color. These six SNPs constitute two haplotype blocks that span 11 kb and 7 kb of the TIMP3 gene.
